2 Beaten Down Stocks - Over 30% Upside!
+ Market Update
Market Latest
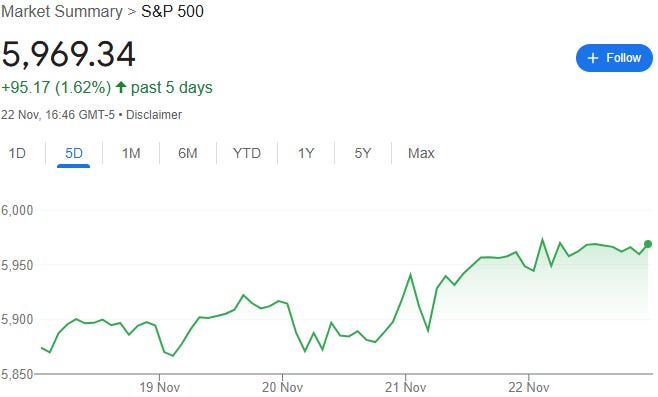
The market looks like it is soon heading past 6,000 once again as we end a fairly good week at 5,969.
The S&P 500 was up 1.57% on a fairly turbulent week.
The majority of stocks had a decent week, although some were down significantly (we’re looking at you Target).
Biggest losers last week included:
Target (TGT) down 18%
Intuit (INTU) down 7%
Ulta Beauty (ULTA) down 7%
Alphabet (GOOGL) down 4%
Amazon (AMZN) down 3%
and others.
Tesla (TSLA) was one of the biggest winners up 10%.
Notable News
DOJ Breakup of Google
The DOJ has called for Google to sell off its Chrome browser, which scared shareholders as the share price slide down 4% on the week.
Remember Alphabet was already the cheapest mag7 Company based on Forward P/E, now it is even cheaper.
Cheaper doesn’t however necessarily mean it is undervalued.
For our thoughts, check our latest video from last week:
Nvidia Earnings
Another double beat for Nvidia:
For a more detailed analysis, check out our earnings review and analysis below:
Bitcoin Rally
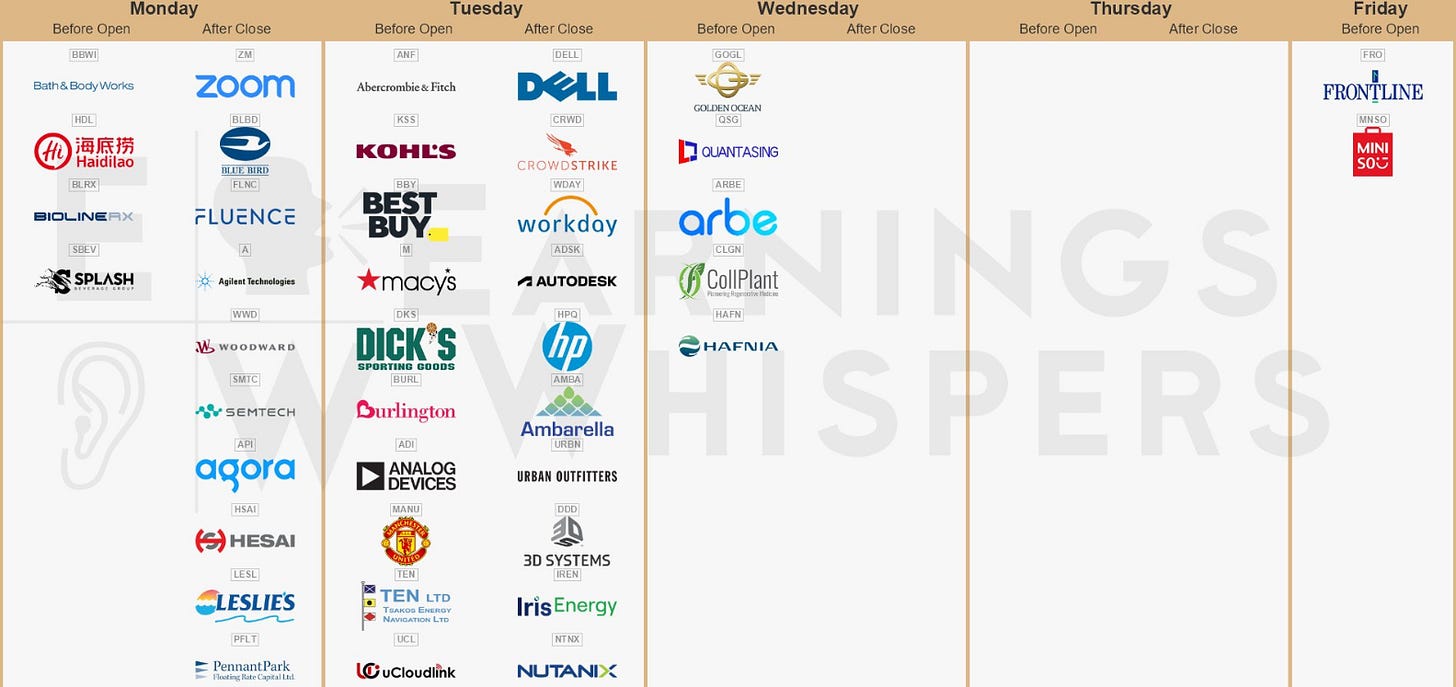
Earnings This Week
Earnings season has started to come to an end with a handful of Companies reporting this week:
As always, we will cover this on our YouTube channel, and for those that aren’t subscribed, we would love to have you in our community which is over 60,000:
Fear and Greed Index
We end the week sitting in Greed (score of 61):
Last week we sat in neutral (score of 51).
2 Beaten Down Stocks With Over 30% Upside
Let’s dive into 2 stocks we like that have been beaten down recently and have more than 30% upside over the next 12 months according to Wall Street analysts:
Lam Research (LRCX)
LAM Research designs and manufactures equipment that enables the fabrication of advanced semiconductor chips used in electronics.
LAM Research’s innovations drive the progress of Moore’s Law, enabling smaller, faster, and more energy-efficient chips. The company is a critical supplier for semiconductor giants like Intel, TSMC, and Samsung, and plays a pivotal role in advancing technologies like AI, 5G, and IoT.
LAM Research's revenue streams primarily come from the following areas:
Equipment Sales: Selling semiconductor fabrication equipment for processes like etching, deposition, and cleaning to chip manufacturers.
Services and Spare Parts: Providing maintenance, upgrades, spare parts, and support for installed equipment.
Customer Support Contracts: Long-term service agreements for performance optimization and reliability.
Technology Solutions: Licensing and providing advanced technologies or custom solutions for specific manufacturing needs.
These streams are driven by demand from industries like consumer electronics, automotive, data centers, and telecommunications.
Over the last 10Y LRCX has MASSIVELY outperformed the S&P 500.
Lam Research also currently trades close to its 52 week low.
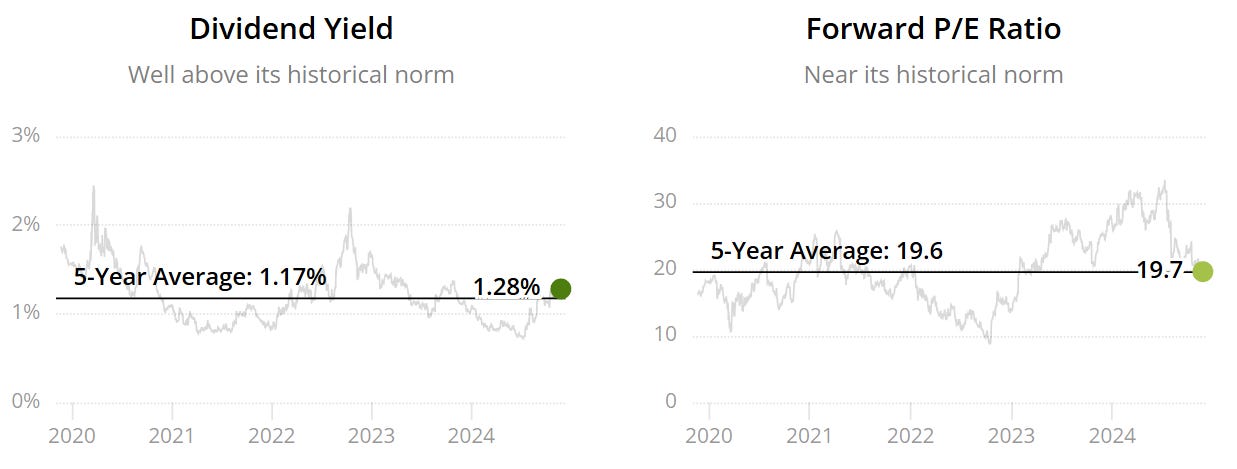
As per below, we get a double reasonable valuation signal as the current yield is marginally higher than the 5Y average (1.28% v 1.17%) and the Forward P/E is marginally higher than the 5Y (19.7x v 19.6x).
Dividend Safety score of 66 indicates safety.
Extremely attractive dividend increases, with an average of 46% every year, over the last 10 years.
ROIC below is very strong to note, currently at 34% on a trailing twelve-month basis.
Extremely impressive and gives us faith that management are able to effectively allocate their capital.
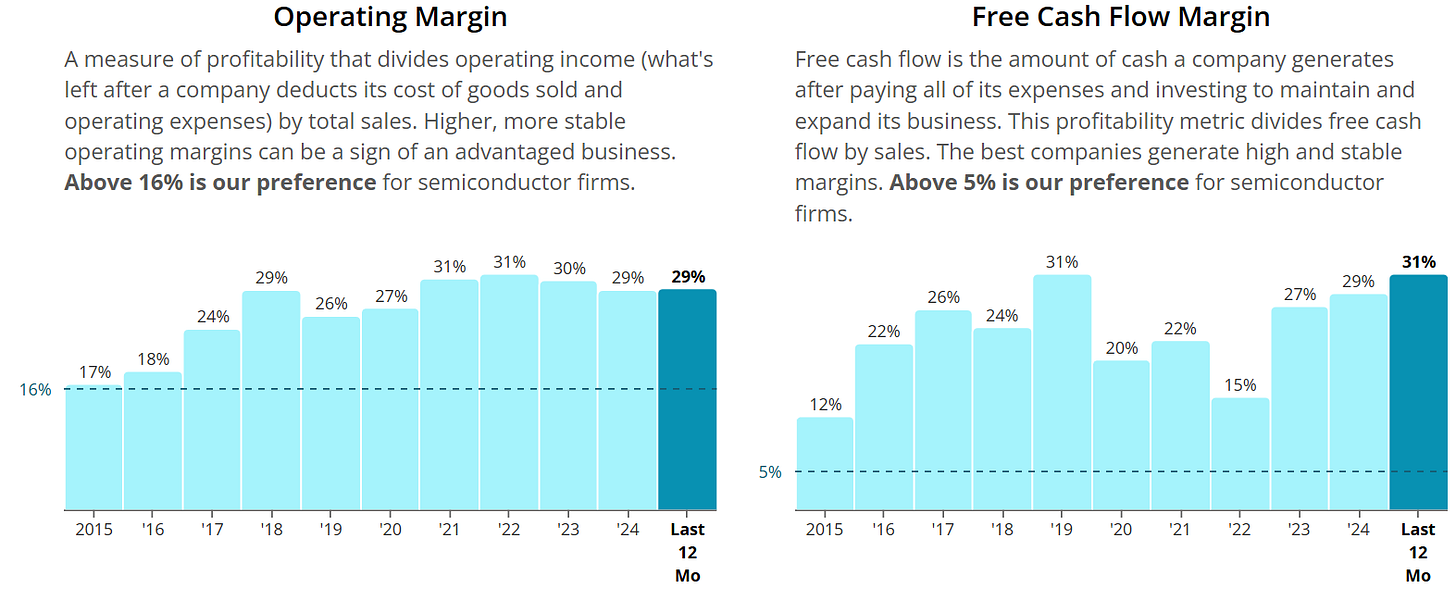
Margins look very good too, in fact on the operating side we note operating efficiency. 17% OM in 2015, now sitting at 29% in 2024.
Net Debt to EBITDA is 0 on a trailing twelve-month basis.
Remember numbers below show us the number of years it would take management to pay off all of their debt net of cash on hand.
Thereby meaning it wouldn’t even take Lam Research 1 day to pay off all of their debt, net of cash on hand.
Excellent balance sheet.
As per below, Wall Street see 36% upside over the next 12 months.
When we last ran it through our valuation model our intrinsic value came to $98:
So, in conclusion for LRCX, we see around a 25% margin of safety around the $173 mark with Wall Street indicating 36% upside.
Qualcomm (QCOM)
Qualcomm develops semiconductor technologies and solutions, specializing in wireless communications, mobile processors, and 5G technologies for devices like smartphones, IoT, and automotive systems.
Qualcomm's revenue streams come primarily from:
Chipset Sales: Selling processors, modems, and other semiconductor components (e.g., Snapdragon platforms) for smartphones, IoT, automotive, and other devices.
Licensing: Earning royalties by licensing its extensive portfolio of wireless communication patents (e.g., 3G, 4G, 5G technologies) to device manufacturers.
Services and Software: Providing software solutions, platform services, and cloud-based technologies to enable AI, connectivity, and edge computing.
These streams are driven by Qualcomm's leadership in mobile technologies and its essential role in the global 5G ecosystem.
Over the last 10Y QCOM has had a very similar performance to the S&P 500.
Qualcomm also currently trades towards the lower end of the 52 week range.
As per below, we get an undervaluation signal as the current yield is marginally higher than the 5Y average (2.19% v 2.15%) and the Forward P/E is lower than the 5Y (13.8x v 15.8x).
Dividend Safety score of 80 indicates safety.
Historically they have increased the dividend at a rate of 15% every year over the last 20 years.
ROIC below is very strong to note, currently at 25% on a trailing twelve-month basis, above the 12% minimum we seek for semiconductors.
Margins look very good too, whilst we have inconsistency, they are still both very high and above the minimums for the industry.
Excellent balance sheet too!
As per below, Wall Street see 30% upside over the next 12 months.
When we last ran it through our valuation model our intrinsic value came to $220:
So, in conclusion for QCOM, we see around a 30% margin of safety around the $154 mark with Wall Street indicating 31% upside.
If you want a more in depth dive on Qualcomm, we did just review it last week on the YouTube channel:
Stock Resources
Stock Valuation Model
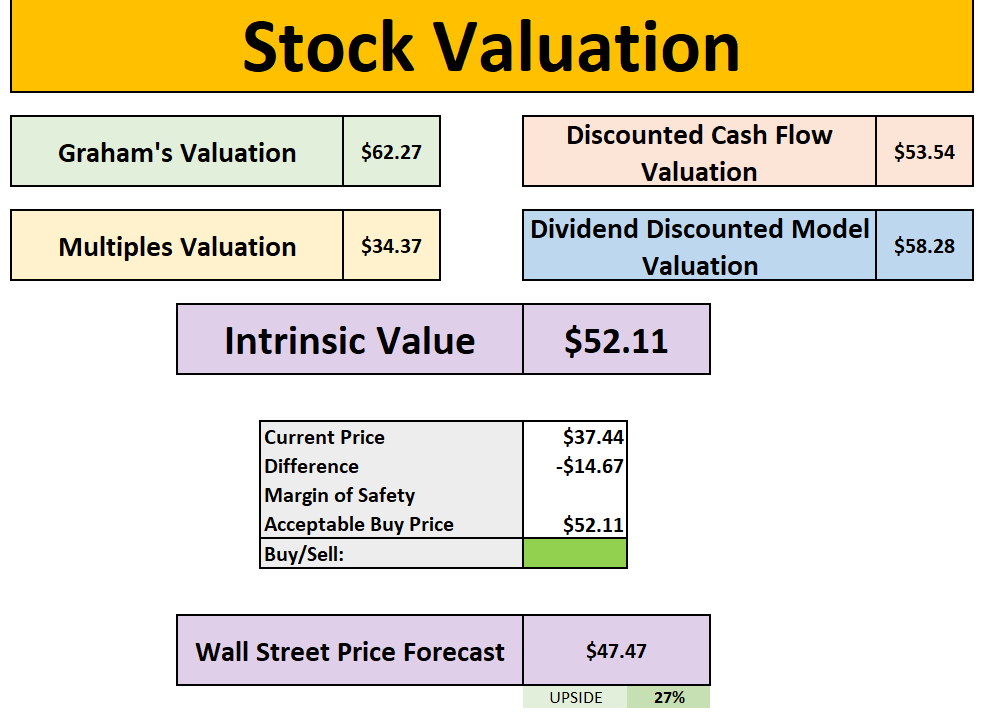
If you are interested in valuing stocks yourself, we have created a valuation model below which you can pick up, this is the same version we use in our YouTube analysis:
Seeking Alpha (the stock analysis website I use in my videos)
MASSIVE BLACK FRIDAY SALE:
Seeking Alpha (the stock analysis website I use in my videos) have just released a huge price drop:
Seeking Alpha Premium: WAS $299, NOW $209/Year (7-day free trial for new paid subscribers, $90 discount).
Alpha Picks: WAS $499, NOW $359/Year ($140 discount, +170.39% return since July 2022 vs. S&P 500’s +55.20%).
Alpha Picks + Premium Bundle: WAS $798, NOW $509/Year ($289 discount, no free trial included). Take advantage by signing up below:
Patreon
Join our community in the Patreon where we discuss weekly buy and sells.
Snowball Portfolio Tracker
Snowball is a great portfolio tracker which allows you to have all of your investments in one place, with a ton of amazing features.
You can also get a 14-day free trial to check it out:
Conclusion
We have just gone through 2 beaten down stocks with over 30% upside.
However as always do your own due diligence and let us know your thoughts about today’s newsletter in the comments.
I hope you all have a great week ahead!
Thanks For Reading!
If you’d like to support this work feel free to buy me a coffee. The proceeds will contribute to the running costs of the newsletter.
Join the community of investors - subscribe now to receive the latest content straight to your inbox each week and never miss out on valuable investment insights.
If you found today’s newsletter helpful, please consider sharing it with your friends and colleagues on social media or via email. Your support helps to continue to provide this newsletter for FREE!
Note:
I am not a financial advisor or licensed professional. Nothing I say or produce anywhere, should be considered as advice. All content is for educational purposes only. I am not responsible for any financial losses or gains. Invest and trade at your own risk.


