
2 Stocks to Buy After the Crash
Here’s where I’m putting my money.


Market Update
The S&P 500 just posted its worst week since early 2020, dropping over 8% as investor sentiment took a hit.

Concerns over new tariffs and a weaker-than-expected jobs report sparked fears of a slowdown, sending both stocks and bond yields lower.

We also witnessed The Nasdaq 100 (an index of 100 of the largest non-financial companies, primarily focused on technology) officially entering a bear market—defined as a decline of 20% or more from its recent peak.

On Thursday, April 3, 2025, the S&P 500 experienced a significant decline of 4.8%, erasing approximately $2.4 trillion in market value, marking its most substantial one-day drop since March 2020.

On Friday, April 4, 2025, the S&P 500 suffered one of its worst single-day drops, plunging 6% as fears of a global trade war escalated following China’s retaliatory tariffs against the U.S.
This sharp decline followed Thursday’s significant loss, contributing to a devastating two-day market rout.
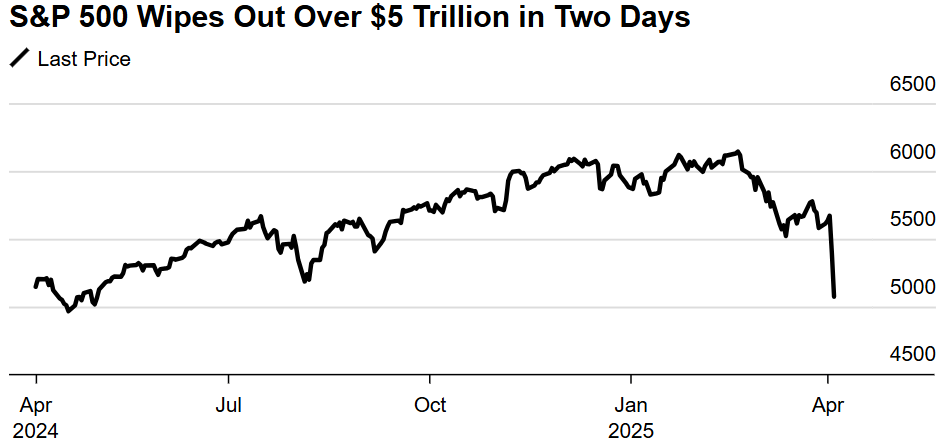
The two days in combination wiped out over $5 Trillion from the S&P 500.

On a more granular level, some stocks were in the red quite significantly.
Biggest losers included:
Boeing (BA) down 21%
Advanced Micro Devices (AMD) down 17%
Qualcomm (QCOM) down 17%
Starbucks (SBUX) down 16%
Nvidia (NVDA) down 14%
Broadcom (AVGO) down 14%
Chevron (CVX) down 14%
American Express (AXP) down 12%
and many, many others.
Notable News
Tariffs
On April 2, President Donald Trump unveiled the long-anticipated U.S. reciprocal tariff measures under the International Emergency Economic Powers Act.
Beginning April 5, a universal 10% tariff will be applied to all countries.
Additionally, starting April 9, higher tariffs will target nations with which the U.S. runs significant trade deficits. China will face a combined tariff rate of 34%, adding to the 20% already implemented earlier this year.
Other key trading partners, including the European Union, Vietnam, and Japan, will see tariffs of 20% or higher.

(This is just page 1 of a number of slides).

While tariffs may pose a challenge to economic growth, the U.S. economy is entering this phase from a strong position:
Over the past two years, real GDP has grown at an above-average rate, and S&P 500 earnings per share saw an impressive 18% growth in Q4, the best since late 2021.
Household balance sheets are in good shape, with debt-service ratios lower than pre-pandemic levels, and the labor market remains solid, despite some expected softening.
Initial jobless claims have been averaging around 221,000 in 2025, well below the 30-year average, while March’s nonfarm payrolls rose by 228,000—far exceeding expectations. The unemployment rate ticked up slightly to 4.2%.
Inflation and Interest
The proposed tariffs could drive up inflation in the short term, as U.S. importers are likely to pass some of the added costs onto consumers.
During the 2018–2019 tariff period, prices rose slightly before easing, but given the size of the tariffs announced last week, the inflationary impact is expected to be more pronounced this time.
Last week, Federal Reserve Chair Jerome Powell discussed the potential impact of President Trump’s new tariffs, warning that they could lead to higher inflation and slower economic growth.
Despite market speculation about possible rate cuts, Powell reaffirmed the Fed’s commitment to making policy decisions based on the economy's performance.
He emphasized that the central bank will remain independent, even as tensions rise between the White House and the Fed amid growing economic uncertainty.
Recession?


Recession odds have started to increase with a view from many that it is likely there will be a global recession in the second half of 2025.
Earnings This Week

Join 87,000+ investors on YouTube! 🎥
We dive deeper into earnings (and more) on our channel. Don't miss out—click below to watch now!👇
YouTube Channel 🔔
Click here to subscribe and stay updated!
Fear & Greed Index

2 Stocks To Buy
Let us dive into these 2 Stocks:
I have used the following criteria to help identify these cheap stocks:
Margin of Safety 25%+
Upside 50%+
ROIC 10%+
Net Debt to EBITDA <1
Amazon (AMZN)
Amazon is a global e-commerce, cloud computing, and digital services company.
It operates an online marketplace selling products from various categories and provides services like Amazon Prime, AWS (cloud computing), and Kindle.
The company also develops smart devices (Alexa, Echo) and produces entertainment content through Amazon Studios.
Additionally, it has expanded into logistics, grocery stores (Whole Foods), and AI technology.

Amazon's income streams include:
E-commerce Sales – Revenue from selling products on Amazon.com, including first-party (Amazon-owned inventory) and third-party marketplace sales (where Amazon takes a commission).
Amazon Web Services (AWS) – Cloud computing services, including hosting, storage, and AI solutions, which generate high-margin revenue.
Subscription Services – Revenue from Amazon Prime memberships, Kindle Unlimited, and other recurring services.
Advertising – Ads displayed on Amazon’s platform, sponsored product listings, and video advertisements.
Physical Stores & Other Ventures – Sales from Whole Foods, Amazon Fresh, and brick-and-mortar stores, as well as emerging businesses like healthcare and AI services.

They have outperformed in all of their last 4 quarters (vs analyst expectations), and expect growth in the next 4.

AWS (their fastest growing revenue segment) currently has a 30% global market share and grew 19% Y/Y.


They have massively outperformed against the S&P 500 over the last 10Y.

Their second fastest growing revenue stream (advertising) was up 18% Y/Y

Amazon does trade above the sector on a Forward P/E by 102%, however they currently trade 85% lower than their historical 5Y average.

The same conclusion arrives even if you look at P/S, P/B and P/CF.

Their FCF has been increasing over time and only expects to increase further over the next 12 months.

Out of the last 10Y, 9 of them they have increased revenue by double digits, including the most recent 2024.

ROIC has also been improving significantly, from the lows of 2022 at 3%, it now sits at 12%.

This is very important as they expect to spend $100bn on CAPEX for their AI strategy this year.


Margins are also looking healthy.

They also have a strong balance sheet as Net Debt to EBITDA currently sits at 0.34.
Remember this is the number of years it would take them to pay off all of their debt, net of cash on hand.

As per above, Wall Street see 57% upside over the next 12 months.
When we last ran it through our valuation model our intrinsic value came to $230:

So, in conclusion for AMZN, we see around a 25% margin of safety around the $173 mark with Wall Street indicating 58% upside.
ASML (ASML)
ASML is a Dutch company that designs and manufactures advanced photolithography machines used in semiconductor chip production.
Their extreme ultraviolet (EUV) lithography technology is essential for producing smaller, more powerful, and energy-efficient microchips.

ASML's main income streams come from selling photolithography machines (including EUV and deep ultraviolet systems), maintenance and service contracts, and software solutions for chip manufacturing optimization.
They also generate revenue from upgrades and enhancements to existing machines.
Photolithography Machine Sales – Revenue from selling EUV and DUV lithography systems to semiconductor manufacturers.
Service & Maintenance Contracts – Ongoing support, repairs, and maintenance for installed machines.
Software Solutions – Revenue from software tools that optimize chip manufacturing and machine performance.
Upgrades & Enhancements – Selling hardware and software upgrades to improve the efficiency of existing machines.


They have outperformed in their last 4 quarters (vs analyst expectations) and anticipate growth against the year-on-year EPS comparative for 3 of the next 4 quarters.

They have massively outperformed against the S&P 500 over the last 10Y.

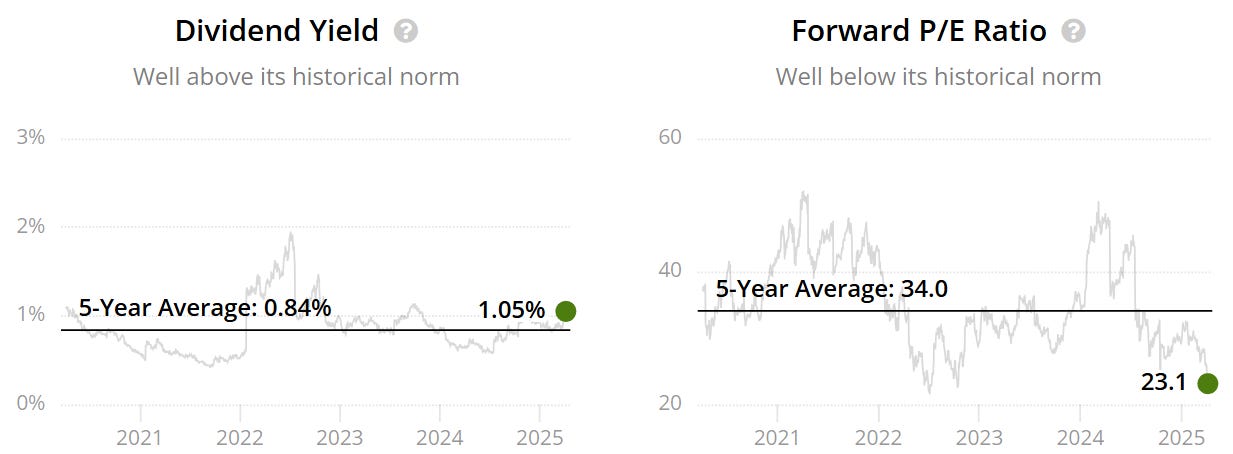
We have a double undervaluation signal, as yield 1.05% is above the 5Y average of 0.84%, as well as the Forward P/E of 23.1x being below the 5Y 34x.
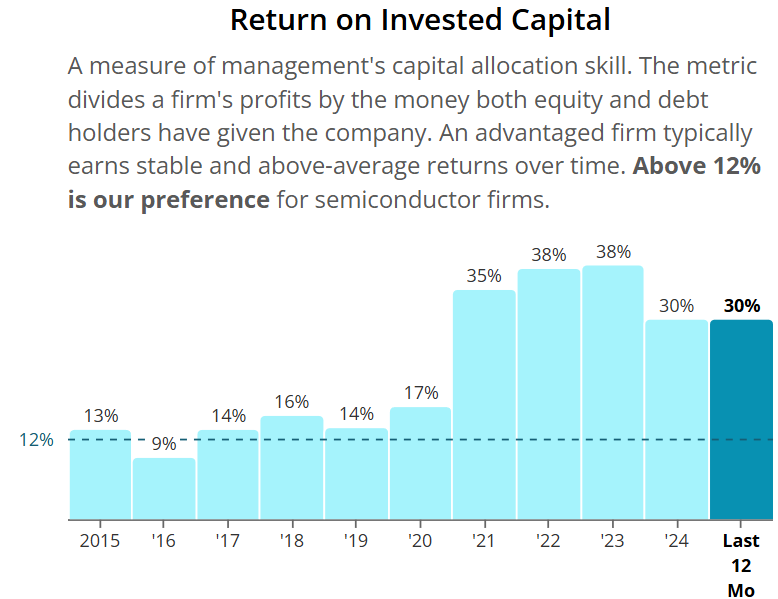
ROIC looks very very good and has been increasing over time, currently sitting at 30%.
Both operating and free cash flow margin have been consistently healthy above the minimum levels.

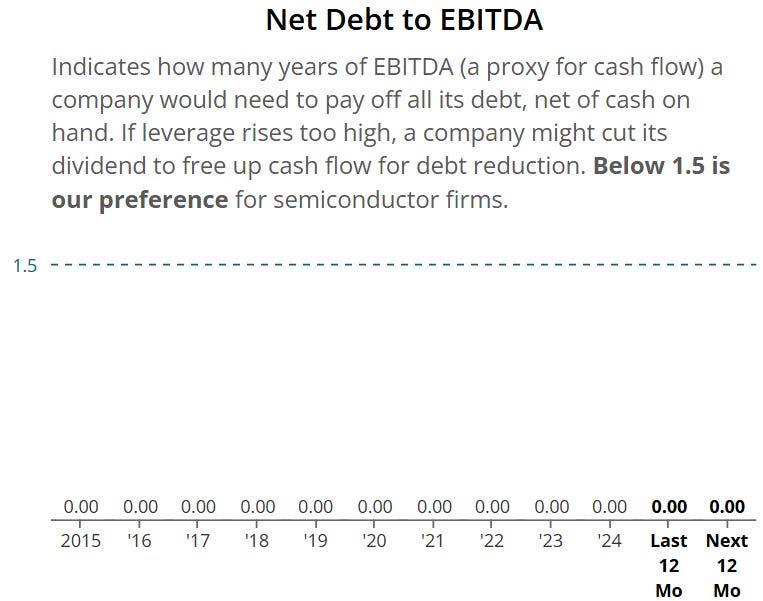
Net Debt to EBITDA sits at 0 over the last 10Y and expected over the next 12 months, meaning it won’t even take them 1 day to pay off all of their debt, net of cash on hand. Excellent balance sheet.
As per below, Wall Street see 54% upside over the next 12 months.

When we last ran it through our valuation model our intrinsic value came to $1,055:

So, in conclusion for ASML, we see around a 40% margin of safety around the $633 mark with Wall Street indicating 54% upside.
Stock Resources
Stock Valuation Model 📊 (Unlock my stock valuation model as seen on YouTube)
Seeking Alpha 💵 ($30 off stock research tools I use daily.)
TipRanks 📈 (50% off expert stock research tools)
YouTube 🎥 (Join 85,000+ investors on YouTube!)
Patreon 👥 (Join my community for exclusive content)
Thanks For Reading!
☕ Buy Me A Coffee – Your support helps cover the costs of running the newsletter.
📬 Join the community – Subscribe now to get weekly investment insights delivered straight to your inbox.
💬 Found this helpful? Share it with friends and colleagues! Your support keeps this newsletter FREE.
I hope you all have a great week ahead! 🌟
Dividend Talks💰
Note:
I’m not a financial advisor. All content is for educational purposes only. Invest and trade at your own risk—I'm not responsible for any financial outcomes.