
2 Stocks To Consider After Market Correction!
+ Market Update


Market Latest
Last week, the S&P 500 experienced significant volatility, ultimately declining by 2.85%.
We did see a small 0.6% gain on Friday to close out the week however this was insufficient to offset earlier losses in the week.

This downturn was influenced by several factors:
Concerns over the U.S. economy.
Uncertainty regarding President Trump's tariff policies.
Slightly weaker-than-expected jobs report.
Year-to-date, the S&P 500 has decreased by 1.7%, reflecting ongoing market challenges and investor apprehension.
The NASDAQ 100 also entered into a Technical Correction.
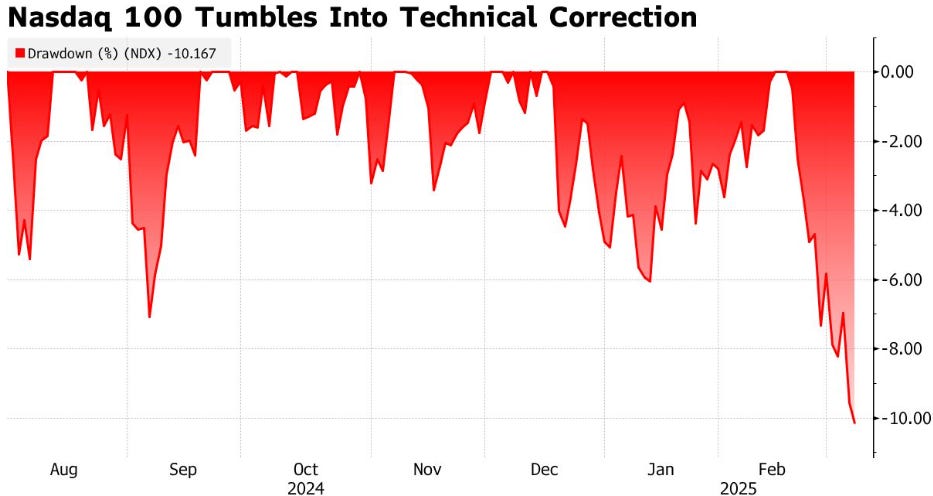
A Technical Correction - a fall in the market value by 10%.
Since the Nasdaq 100 hit a record high on Feb. 19, Nvidia has lost more than a fifth of its value and is responsible for 18% of the index’s overall decline.
On a granular level we can see a lot of red.
Biggest losers included:
Intel (INTC) down 13%
Boeing (BA) down 12%
Dell (DELL) down 11%
Tesla (TSLA) down 10%
Nvidia (NVDA) down 10%
American Express (AXP) down 9%
Netflix (NFLX) down 9%
Costco (COST) down 8%
and many, many other.
Notable News
Recession?
The Atlanta Fed’s GDP tracker now projects a -2.4% annualized growth rate for the first quarter, down from a peak of 3.9% earlier this year.

A significant driver of this decline has been a sharp increase in imports, as companies stock up ahead of potential tariffs.
However, this trend is unlikely to persist and should stabilize or reverse in the coming months.
Additionally, consumer spending has also weakened, with consumption growth now expected to slow to approximately 0.4% in the first quarter, compared to a previous high of 4.1%.
More Interest Rate Cuts?
Markets have shifted from expecting no rate cuts to anticipating around three cuts in 2025.
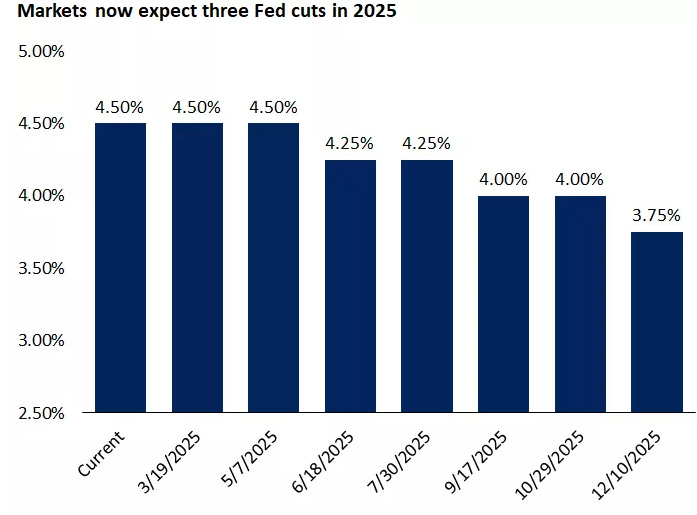
Fed Chair Powell stated last week that the economy is still in solid shape.
While consumer spending is slowing and uncertainty remains high, he expects the Fed to take a patient approach to rate adjustments.
Market Rotation Into Defensive Sectors?
With the economy potentially slowing and policy uncertainty rising, markets are reacting cautiously.
The S&P 500 has declined about 2% year-to-date, while the tech-heavy Nasdaq is down roughly 6%.
After two years of 20%+ gains in the S&P 500, some consolidation and pullback were likely overdue, and so far, market movements remain orderly.
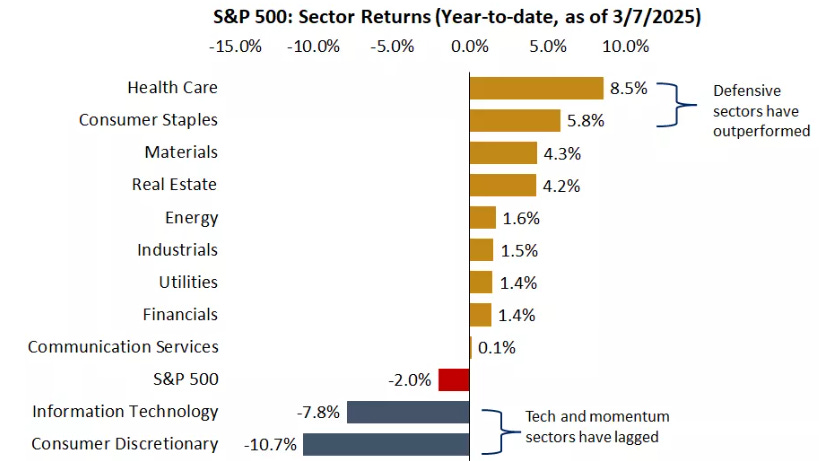
Investors are adopting a more defensive stance across asset classes.
In equities, traditionally "recession-proof" sectors like health care and consumer staples are leading, while sectors that previously saw strong momentum and rising valuations—such as technology (dominated by Apple, Microsoft, and NVIDIA) and consumer discretionary (led by Amazon and Tesla)—are lagging.
Earnings This Week
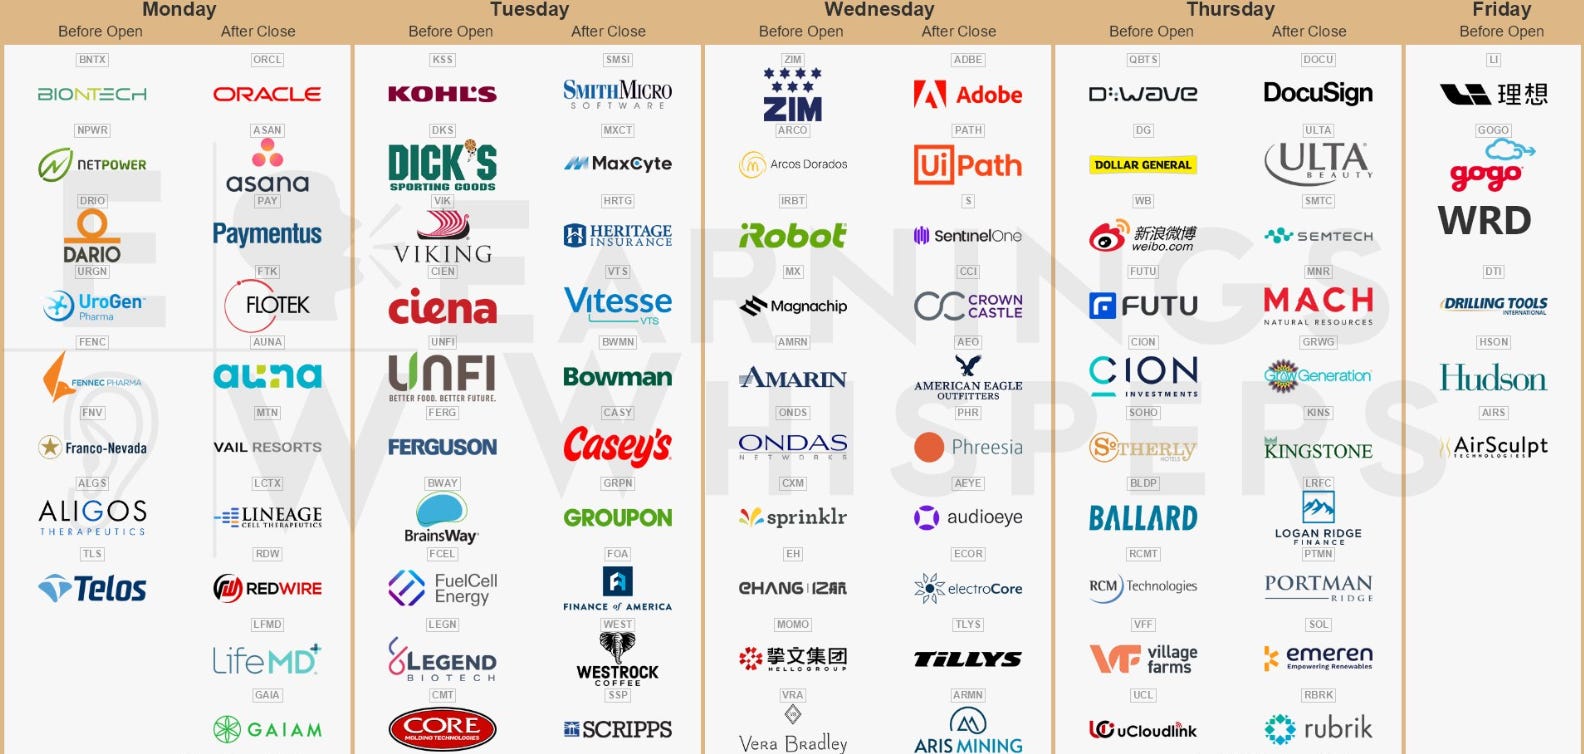
As always, we will cover this on our YouTube channel, and for those that aren’t subscribed, we would love to have you in our community which is near 84,000:

Fear and Greed Index

Another week in Extreme Fear, where investor sentiment is very bearish about the short term future.
2 Stocks To Consider
Let us dive into these 2 Stocks:
I have used the following criteria to help identify these cheap stocks:
Margin of Safety 15%+
Upside 30%+
Amazon (AMZN)
Amazon is a global e-commerce, cloud computing, and digital services company.
It operates an online marketplace selling products from various categories and provides services like Amazon Prime, AWS (cloud computing), and Kindle.
The company also develops smart devices (Alexa, Echo) and produces entertainment content through Amazon Studios.
Additionally, it has expanded into logistics, grocery stores (Whole Foods), and AI technology.

Amazon's income streams include:
E-commerce Sales – Revenue from selling products on Amazon.com, including first-party (Amazon-owned inventory) and third-party marketplace sales (where Amazon takes a commission).
Amazon Web Services (AWS) – Cloud computing services, including hosting, storage, and AI solutions, which generate high-margin revenue.
Subscription Services – Revenue from Amazon Prime memberships, Kindle Unlimited, and other recurring services.
Advertising – Ads displayed on Amazon’s platform, sponsored product listings, and video advertisements.
Physical Stores & Other Ventures – Sales from Whole Foods, Amazon Fresh, and brick-and-mortar stores, as well as emerging businesses like healthcare and AI services.

They have outperformed in all of their last 4 quarters (vs analyst expectations), and expect growth in the next 4.

AWS (their fastest growing revenue segment) currently has a 30% global market share and grew 19% Y/Y.


They have massively outperformed against the S&P 500 over the last 10Y.

Their second fastest growing revenue stream (advertising) was up 18% Y/Y

Amazon does trade above the sector on a Forward P/E by 104%, however they currently trade 82% lower than their historical 5Y average.
The same conclusion arrives even if you look at P/S, P/B and P/CF.

Their FCF has been increasing over time and only expects to increase further over the next 12 months.

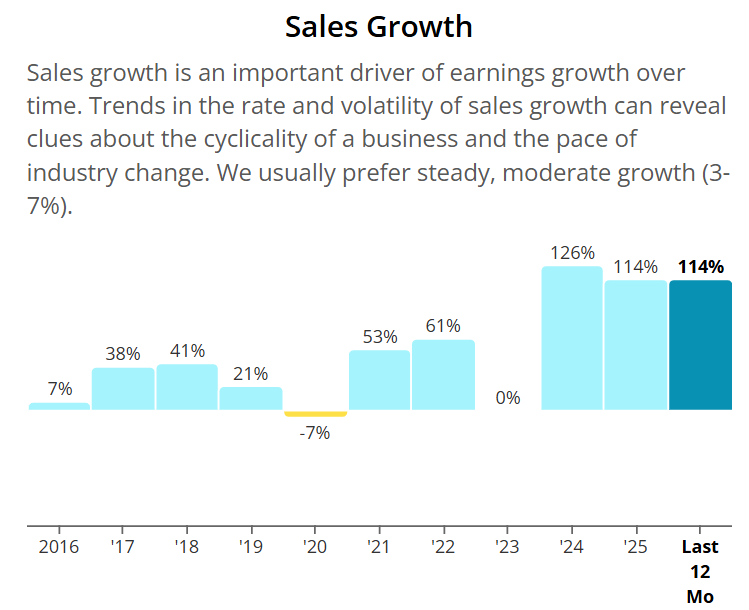
Out of the last 10Y, 9 of them they have increased revenue by double digits, including the most recent 2024.

ROIC has also been improving significantly, from the lows of 2022 at 4%, it now sits at 16%.

This is very important as they expect to spend $100bn on CAPEX for their AI strategy this year.

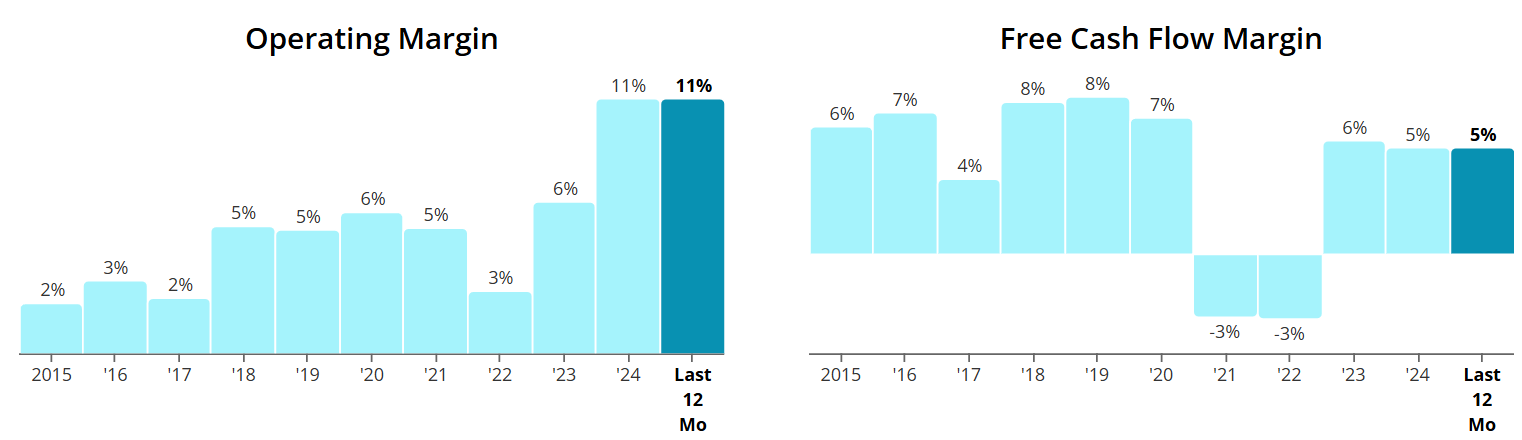
Margins are also looking healthy.

They also have a fairly strong balance sheet as Net Debt to EBITDA currently sits at 0.34.
Remember this is the number of years it would take them to pay off all of their debt, net of cash on hand.

As per above, Wall Street see 36% upside over the next 12 months.
When we last ran it through our valuation model our intrinsic value came to $230:

So, in conclusion for AMZN, we see around a 15% margin of safety around the $196 mark with Wall Street indicating 36% upside.
Nvidia (NVDA)
NVIDIA is a technology company specializing in graphics processing units (GPUs), artificial intelligence (AI), and computing solutions.
It designs GPUs for gaming, professional visualization, data centers, and AI applications.
The company also develops AI software, autonomous vehicle technology, and cloud-based computing services.
NVIDIA’s chips power industries like gaming, AI research, self-driving cars, and high-performance computing.

NVIDIA's income streams include:
Gaming – Revenue from selling GeForce GPUs and gaming-related hardware, including chips for consoles like the Nintendo Switch.
Data Center – High-margin sales of AI and cloud computing GPUs used in data centers, AI training, and enterprise computing.
Professional Visualization – GPUs and software for industries like 3D design, animation, and engineering.
Automotive – AI-powered chips and software solutions for autonomous driving and smart vehicle technology.
OEM & Other – Revenue from licensing, custom chips, and emerging technologies, including AI software and cloud services.

They have outperformed in their last 4 quarters (vs analyst expectations).
They anticipate double digit growth against the year-on-year EPS comparative for the next 4 quarters.

The biggest part of their income stream is data centers which grew 16% Q/Q.


They have massively outperformed against the S&P 500 over the last 10Y.

When looking at their historical Forward P/E, they are trading at a massive undervaluation:

They also trade significantly below their 5Y historical Forward P/E that sits at 42.9x, with their current valuation being 25.3x.

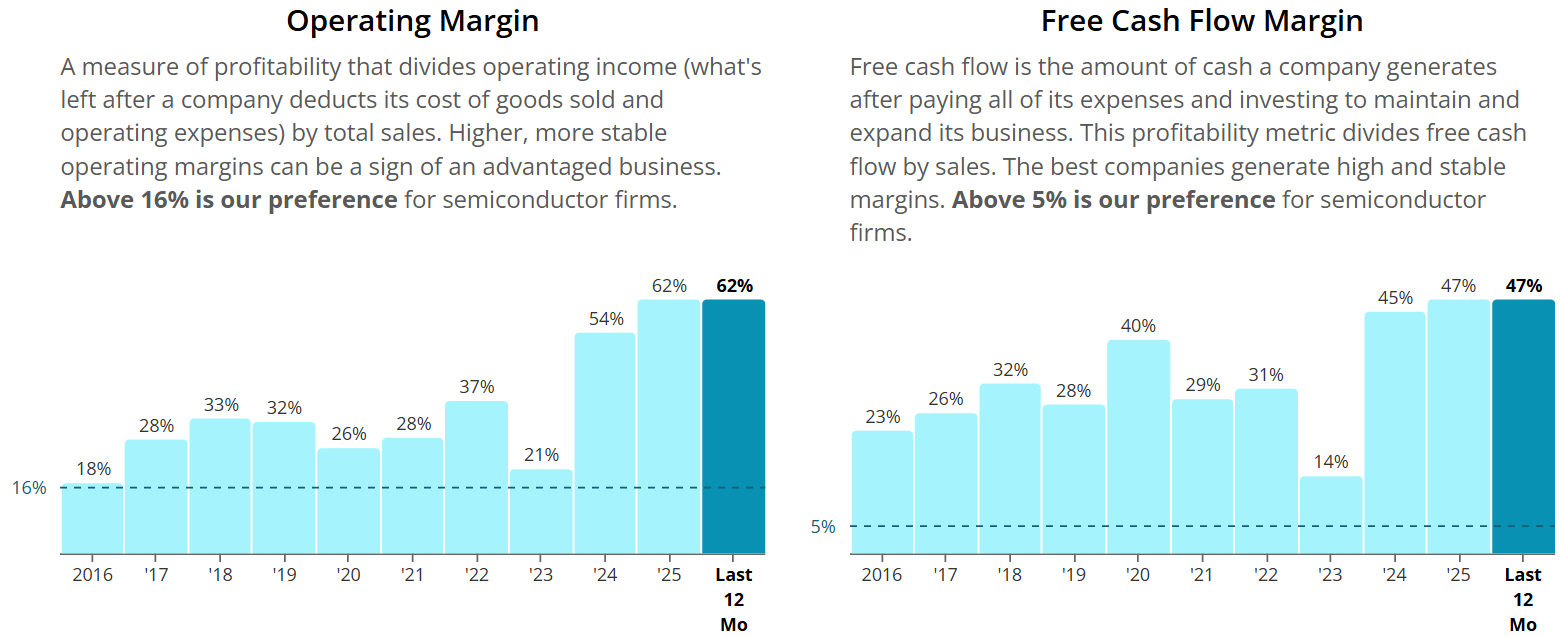
FCF has grown tremendously over the last few years.

The last 2 years also saw triple digit growth to their top line.
One of the best ROIC metrics we have seen at 90%.

We also get to see efficiencies in their margins, growing over time.
Phenomenal balance sheet too, with 0 across the board, meaning it won’t even take Nvidia 1 day to pay off all of their debt net of cash on hand.

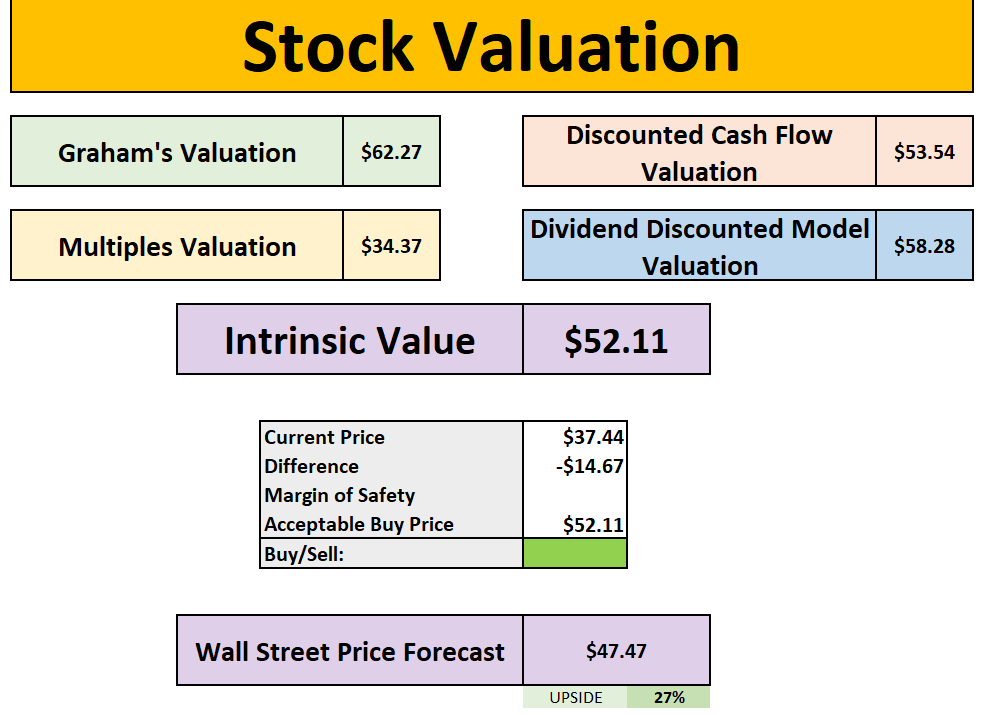
As per below, Wall Street see 57% upside over the next 12 months.

When we last ran it through our valuation model our intrinsic value came to $162:

So, in conclusion for NVDA, we see around a 30% margin of safety around the $114 mark with Wall Street indicating 57% upside.
Stock Resources
Stock Valuation Model
If you are interested in valuing stocks yourself, we have created a valuation model below which you can pick up, this is the same version we use in our YouTube analysis:
Seeking Alpha

They are one of the main stock analysis websites I use in my videos and you can get $30 OFF discount below.
TipRanks
To find the predicted upside of stocks, I typically use TipRanks, for example, using their system for Nvidia (NVDA) we get the below:

They currently have a 50% offer below.
50% OFF TipRanks:
Patreon
Join our community in the Patreon where we discuss weekly buy and sells.
Conclusion
We have just gone through 2 buys to consider in this market correction.
I hope you all have a great week ahead!
Thanks For Reading!
If you’d like to support this work feel free to buy me a coffee. The proceeds will contribute to the running costs of the newsletter.
Join the community of investors - subscribe now to receive the latest content straight to your inbox each week and never miss out on valuable investment insights.
If you found today’s newsletter helpful, please consider sharing it with your friends and colleagues on social media or via email. Your support helps to continue to provide this newsletter for FREE!
Note:
I am not a financial advisor or licensed professional. Nothing I say or produce anywhere, should be considered as advice. All content is for educational purposes only. I am not responsible for any financial losses or gains. Invest and trade at your own risk.