
2 Undervalued Stocks Insiders Are Buying!
These hidden gems are getting major insider love


Market Update
Policy changes continue to fuel sharp market swings, with constant headlines and trade news adding to the volatility.
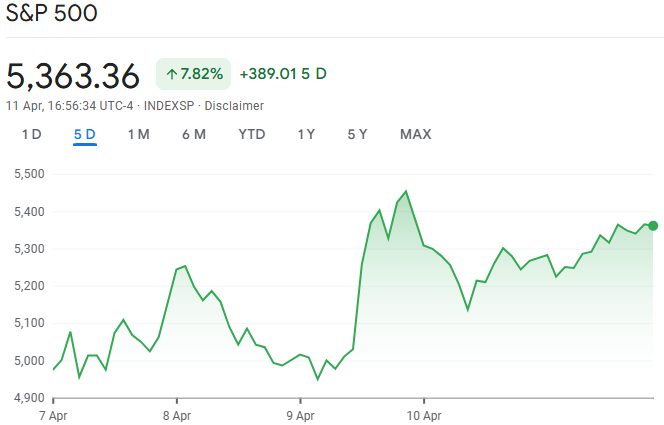
After coming close to a 20% drop from its February 19 peak - the line that marks a shift from a bull to a bear market - the S&P 500 recorded its third-largest daily gain since World War II gaining 7.82%.

This rally came after the White House announced a 90-day pause on newly proposed "reciprocal" tariffs for countries that didn’t retaliate to the April 2 announcement.
The tariff rate was lowered to 10% for those countries, while China’s rate was increased to 145%. In response, China raised its own tariffs on U.S. imports to 125%.
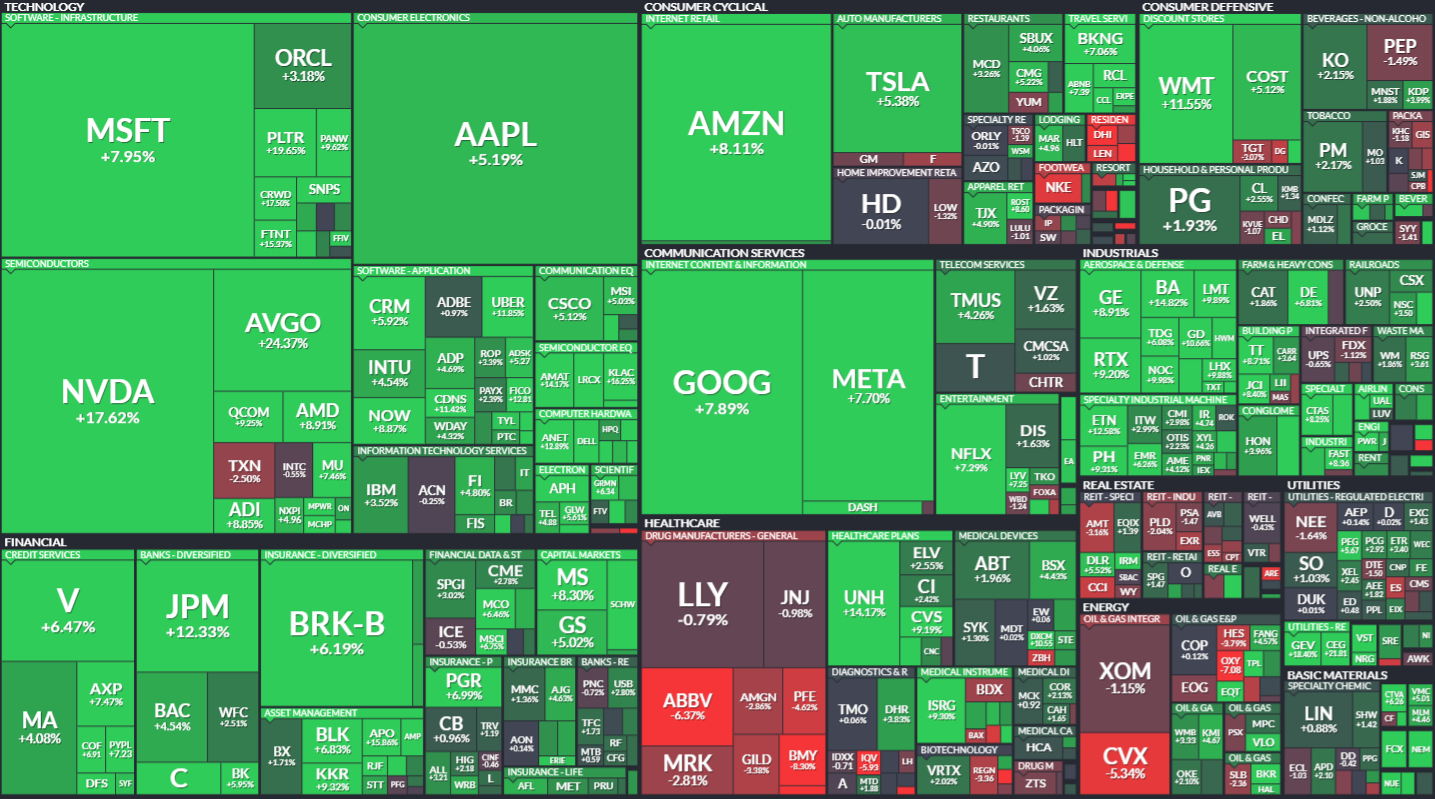
On a more granular level, some stocks were up in the green quite significantly.
Biggest winners included:
Broadcom (AVGO) up 24%
Palantir (PLTR) up 20%
Nvidia (NVDA) up 18%
UnitedHealth Group (UNH) up 14%
Walmart (WMT) up 12%
and many, many others.
Notable News
Uncertainty and Volatility
Historically, the S&P 500’s average intraday move - the difference between its daily high and low - has hovered around 1%.
But since the announcement of the higher tariff plan on April 2, that average has surged to an eye-popping 7%.

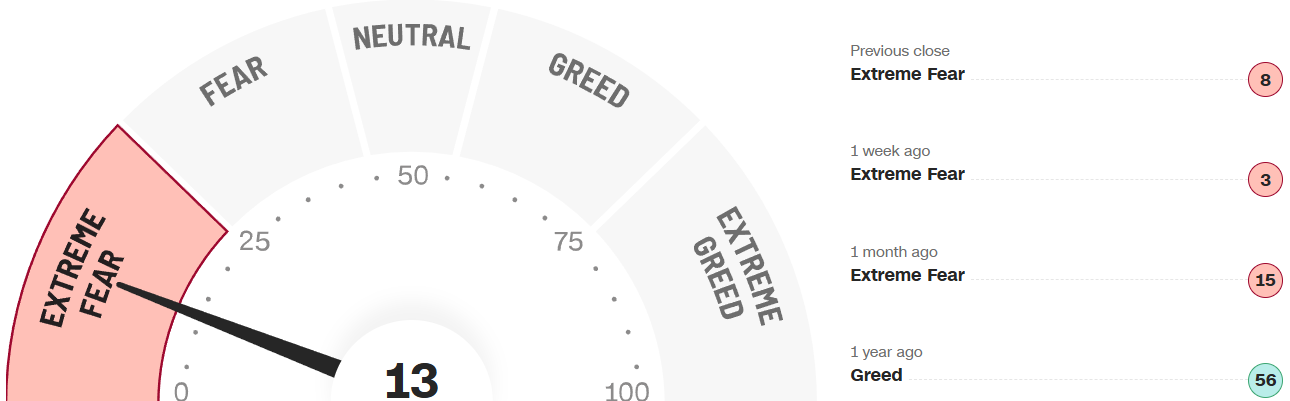
If you needed any more proof of just how wild things have been, look no further than the volatility index (VIX), better known as the “fear index.”
It’s shot up to levels we haven’t seen since the early days of the 2020 pandemic - a spot it’s only reached eight times in the past 35 years.
Usually, when volatility spikes like this, it takes about eight months to cool off. But here’s the good news: history shows that these moments of extreme fear often turn into opportunities for investors who stay patient and stick to their game plan.

Every time the VIX has jumped above 43 - and it hit 52 on April 8, 2025 - the stock market has delivered solid returns over the next six to 12 months.
Not because volatility is good, but because by the time it spikes this high, a lot of the bad news is already priced in.
Attractive Valuations?
A quick, V-shaped bounce back in stock prices isn’t likely as long as these trade tensions stick around.
And with earnings season kicking off with the big banks, we could see a lot of companies lowering their forecasts for the rest of the year.

But it’s not all bad news. The upside to this market pullback is that valuations are starting to look a lot more reasonable.
In fact, one of the big concerns coming into this year was how stretched prices had gotten - and that’s no longer the case.
Right now, all the major indexes are trading at or below their 10-year historical averages, which could lay the groundwork for stronger long-term returns.
Earnings Season Is Back!

Join 88,000+ investors on YouTube! 🎥
We dive deeper into earnings (and more) on our channel. Don't miss out—click below to watch now!👇
YouTube Channel 🔔
Click here to subscribe and stay updated!
Fear & Greed Index
2 Stocks Insider Are Buying
Let us dive into these 2 Stocks Insiders have been Buying:
I have used the following criteria to help identify these stocks to discuss within the insider buying screener:
Margin of Safety 30%+
Upside 40%+
ROIC 10%+
Net Debt to EBITDA <1
Applied Materials (AMAT)
Applied Materials is a company that supplies equipment, software, and services to the semiconductor, display, and solar industries.
They design and manufacture systems used in the production of integrated circuits, flat-panel displays, and solar cells.
Their products help in creating chips that power everything from smartphones to computers.
Applied Materials is a key player in enabling advancements in electronics and energy solutions.

Applied Materials' revenue streams are primarily divided into three segments:
Semiconductor Systems: This segment focuses on equipment used in semiconductor fabrication and is the largest revenue contributor.
Applied Global Services: This segment provides services and support for semiconductor and display manufacturers.
Display: This segment offers equipment for manufacturing flat-panel displays.

The President and CEO bought 50,000 shares on 3rd April costing him just under $7m.

They have outperformed in all of their last 4 quarters (vs analyst expectations), and expect growth in 3 of the next 4.

They have massively outperformed against the S&P 500 over the last 10Y.

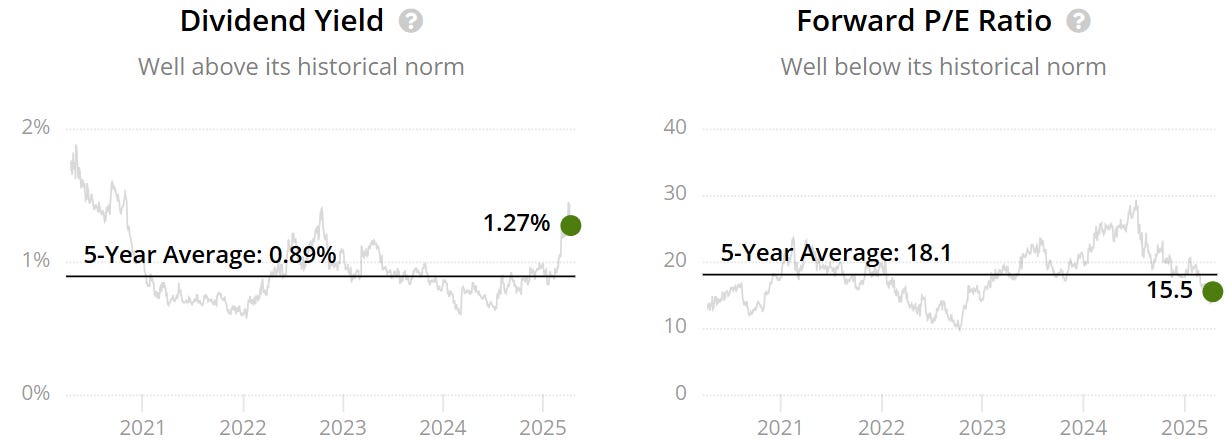
We have a double undervaluation signal, as yield 1.27% is above the 5Y average of 0.89%, as well as the Forward P/E of 15.5x being below the 5Y 18.1x.
ROIC looks very very good and has been increasing over time, currently sitting at 25%.

For a cyclical industry they have been growing their free cash flow at a fairly strong and consistent rate.

They have also been aggressively buying back shares over the last 10Y.

Whilst growing the dividend at a double-digit rate over the last 10Y.

Both operating and free cash flow margin have been consistently healthy above the minimum levels and growing!

Net Debt to EBITDA sits at 0 and expected over the next 12 months, meaning it won’t even take them 1 day to pay off all of their debt, net of cash on hand.
Excellent balance sheet.

As per below, Wall Street see 41% upside over the next 12 months.

When we last ran it through our valuation model our intrinsic value came to $229:

So, in conclusion for AMAT, we see around a 35% margin of safety around the $149 mark with Wall Street indicating 41% upside.
Salesforce (CRM)
Salesforce is a cloud-based software company that provides customer relationship management (CRM) solutions.
It helps businesses manage customer interactions, sales, marketing, and customer service through a suite of tools.
Salesforce also offers platforms for data analytics, app development, and artificial intelligence.
Their services are widely used across various industries to improve efficiency and customer engagement.

Salesforce's revenue streams are primarily divided into the following segments:
Subscription and Support: This segment represents the majority of Salesforce's revenue.
Service Cloud: Focuses on customer service solutions.
Sales Cloud: Provides sales automation tools.
Marketing and Commerce Cloud: Offers marketing and commerce solutions.
Salesforce Platform and Other: Includes platform services and other offerings.

The Director bought 3,882 shares on 3rd April costing him just under $1m.

They have outperformed in 3 of their last 4 quarters (vs analyst expectations), and expect growth in the next 4.

They have massively outperformed against the S&P 500 over the last 10Y.

We have a double undervaluation signal, as yield 0.65% is above the 5Y average of 0.56%, as well as the Forward P/E of 22.8x being below the 5Y 31.8x.

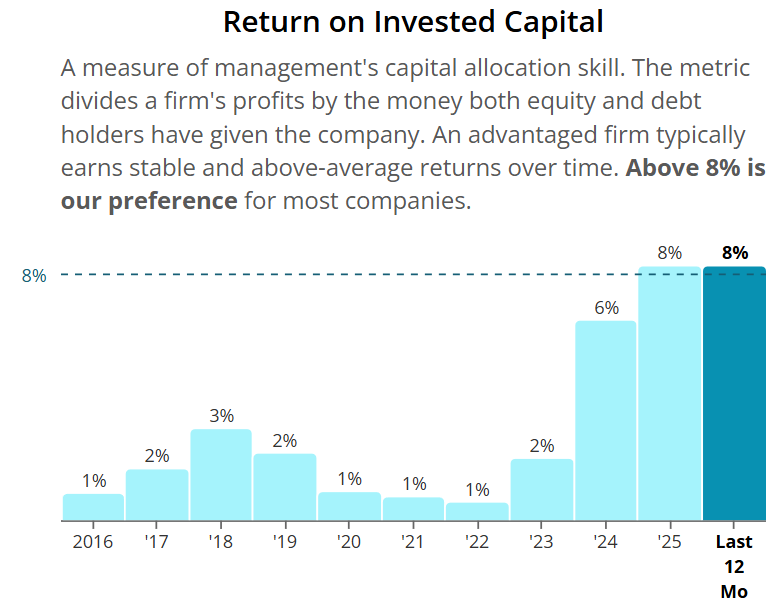
ROIC does leave quite a bit to be desired for, now sitting at 8%.
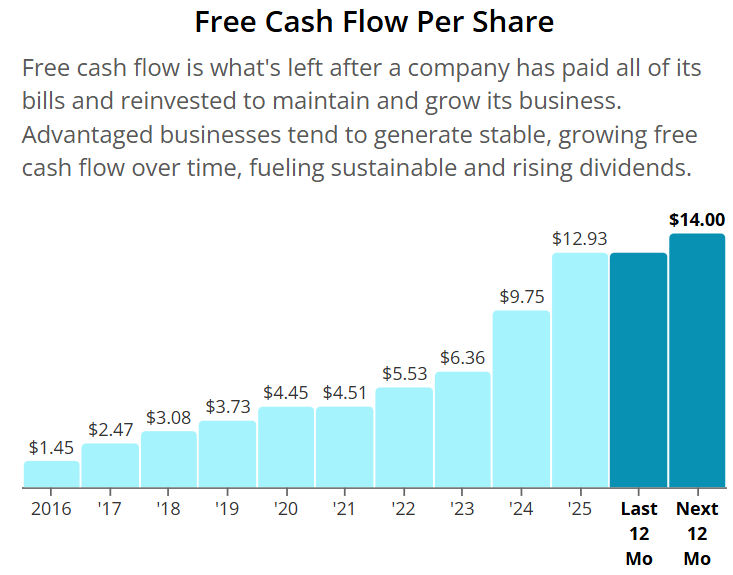
Free cash flow has been growing beautifully and consistently over the last 10Y.
Unlike AMAT, CRM has actually been diluting shareholders as shares outstanding have been increasing over the last 10Y.

Both margins look very strong too with some nice growth over time.

Net Debt to EBITDA sits at 0 and expected over the next 12 months, meaning it won’t even take them 1 day to pay off all of their debt, net of cash on hand.
Excellent balance sheet.

As per below, Wall Street see 46% upside over the next 12 months.
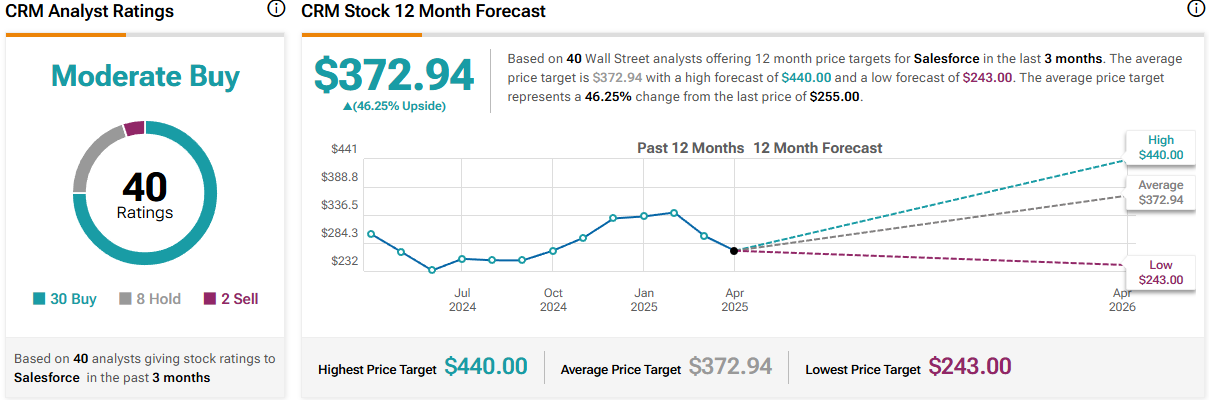
When we last ran it through our valuation model our intrinsic value came to $371:

So, in conclusion for CRM, we see around a 30% margin of safety around the $260 mark with Wall Street indicating 47% upside.
Stock Resources
Stock Valuation Model 📊 (Unlock my stock valuation model as seen on YouTube)
Seeking Alpha 💵 ($30 off stock research tools I use daily.)
TipRanks 📈 (50% off expert stock research tools)
YouTube 🎥 (Join 85,000+ investors on YouTube!)
Patreon 👥 (Join my community for exclusive content)
Thanks For Reading!
☕ Buy Me A Coffee – Your support helps cover the costs of running the newsletter.
📬 Join the community – Subscribe now to get weekly investment insights delivered straight to your inbox.
💬 Found this helpful? Share it with friends and colleagues! Your support keeps this newsletter FREE.
I hope you all have a great week ahead! 🌟
Dividend Talks💰
Note:
I’m not a financial advisor. All content is for educational purposes only. Invest and trade at your own risk—I'm not responsible for any financial outcomes.
If your strategy is to invest in all of these stock tips, good luck!