
2 Undervalued Stocks With Huge Upside
+ Market Update


Market Update
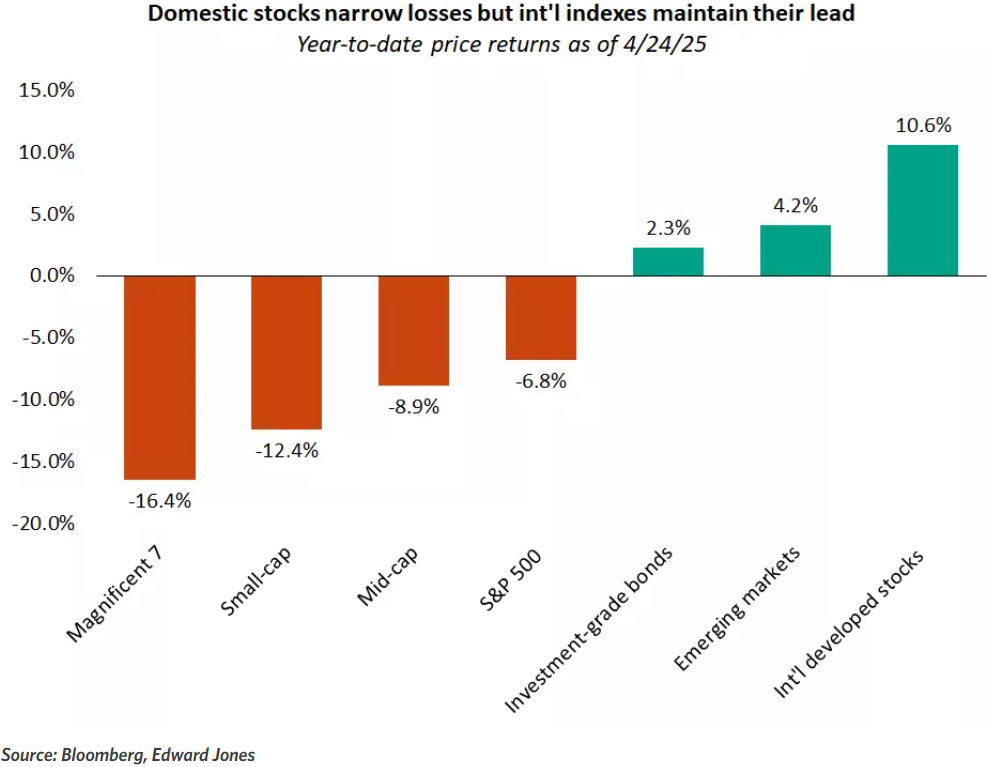
Markets rallied strongly last week with the S&P 500 up more than 6% as the U.S. softened its trade stance and concerns about Fed independence eased.

With tariffs potentially coming down, trade uncertainty and market volatility may have peaked.

After initial fears that high U.S. tariffs would persist, several signs point to a softer stance on trade.
A 90-day pause on new tariffs was a major first step, though rates on imports could still jump significantly.
Recent reports suggest the U.S. may cut tariffs on Chinese goods, while China considers exempting some U.S. products.
Positive progress is also being made in trade talks with South Korea and India.
Although headlines can shift quickly, the U.S. push to ease tariffs hints that the peak in trade uncertainty and market volatility may be behind us.
Notable News
Interest rate cuts are coming soon?
President Trump eased concerns over Fed independence last week, helping Treasury yields settle back near the middle of our expected 4.0%-4.5% range.
With tariffs weighing on growth, GDP is expected to slow to 1.5%-1.7% and inflation to peak around 3.5%-4%.

As the economy cools, the Fed is likely to stay on pause in May but could start cutting rates by June or July.
Market Performance
The S&P 500 has rallied 10% from the April lows but remains about 10% below its February peak, with further gains likely needing real trade agreements, not just easing tensions.
While a sharp V-shaped recovery like 2018 or 2020 is unlikely given inflation and deficit pressures, there are no current signs of a prolonged bear market.
Earnings So Far
Earnings season is off to a strong start, with 75% of companies beating estimates and positive surprises running above the 10-year average.
However, results haven’t yet reflected potential tariff impacts, and some consumer-facing companies are warning of slower spending.
Full-year earnings growth estimates have already dropped from 14% in January to 9.5%.
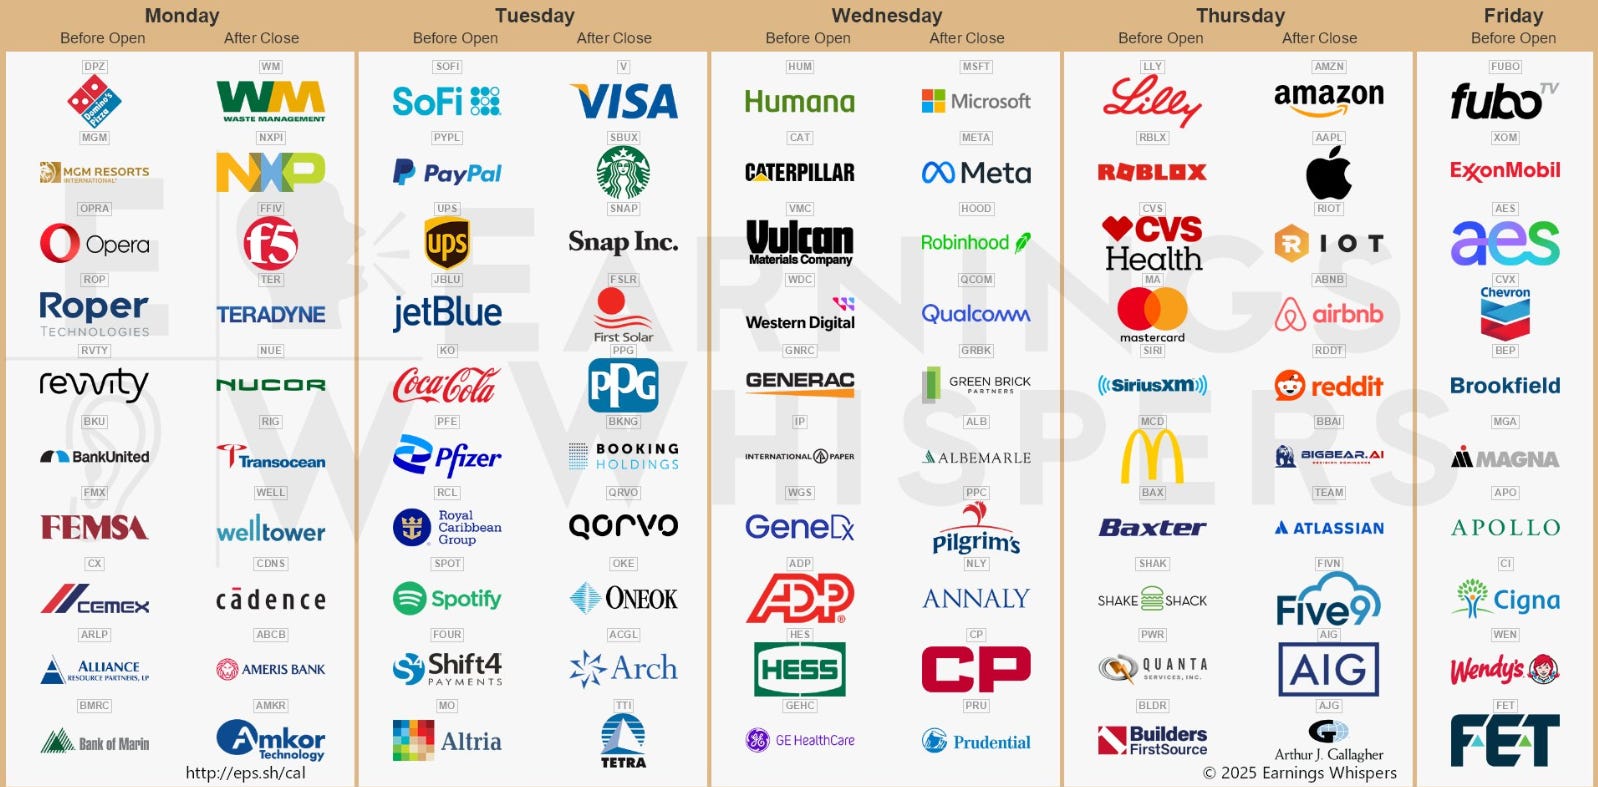
Earnings This week
Join 90,000+ investors on YouTube! 🎥
We dive deeper into earnings (and more) on our channel. Don't miss out—click below to watch now!👇
YouTube Channel 🔔
Click here to subscribe and stay updated!
Fear & Greed Index

2 Huge Upside Stocks
Let us dive into these 2 Stocks.
I have used the following criteria to help identify these stocks:
Margin of Safety 25%+
Upside 25%+
ROIC 10%+
Net Debt to EBITDA <1.5
Adobe (ADBE)
Adobe is a software company best known for creative tools like Photoshop, Illustrator, and Premiere Pro, widely used in design, photography, and video editing.
It also offers digital marketing, analytics, and document solutions, like Adobe Acrobat and Adobe Sign.
Most of its revenue now comes from subscriptions to its Creative Cloud and Digital Experience platforms.
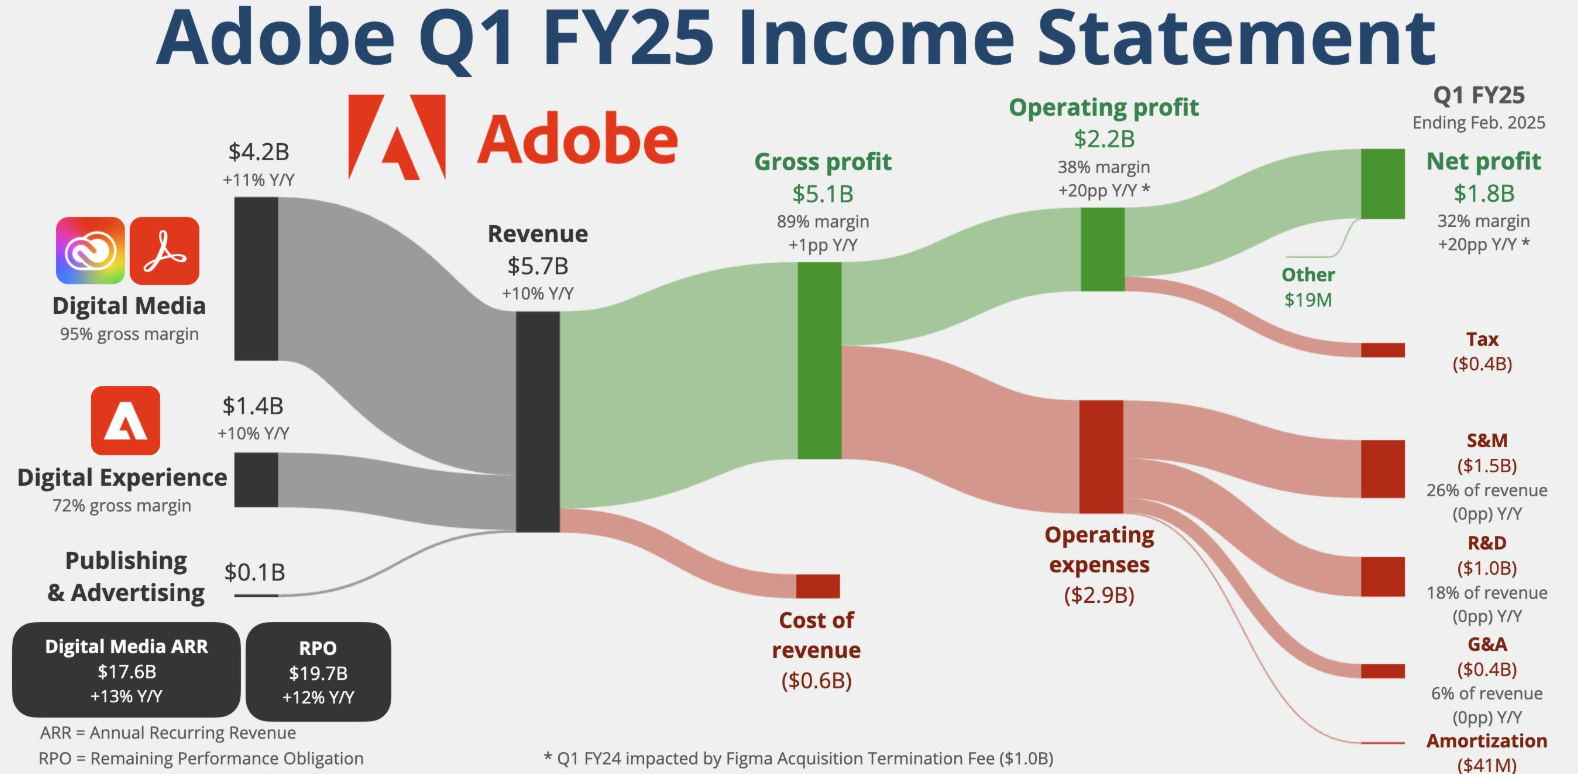
Adobe’s main income streams are:
Digital Media (Creative Cloud): Subscriptions for creative software like Photoshop, Illustrator, Premiere Pro, and InDesign.
Digital Media (Document Cloud): Products like Adobe Acrobat (PDF services) and Adobe Sign (e-signatures and document management).
Digital Experience: Enterprise solutions for marketing automation, customer analytics, content management, and personalization (includes Adobe Experience Cloud).
Publishing and Advertising: Smaller segment covering legacy products (like FrameMaker) and some advertising-related services.
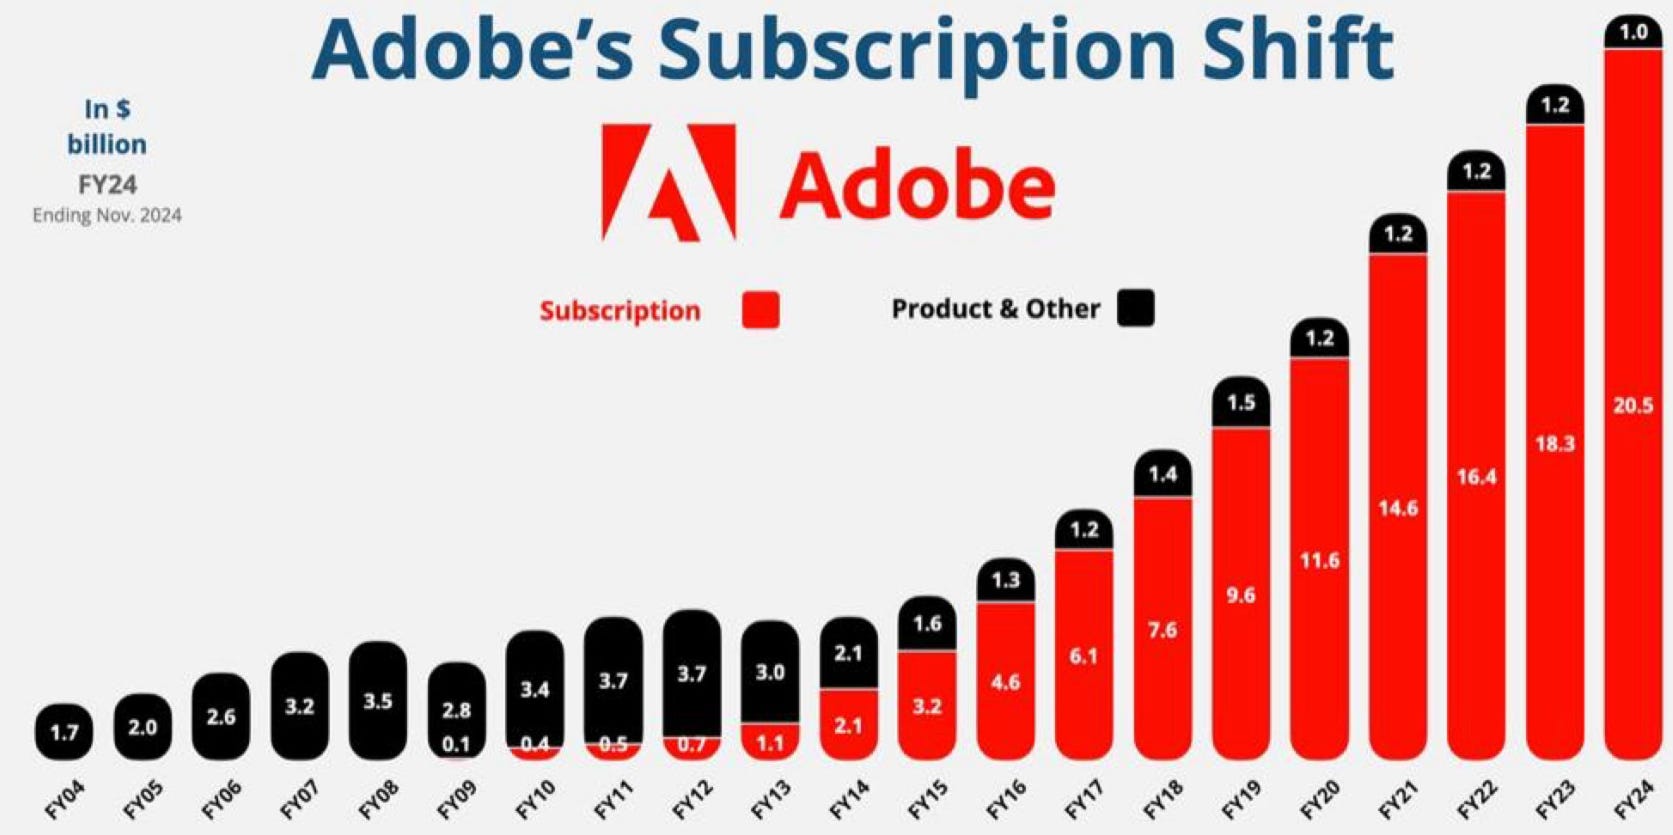
The majority of their revenue now comes from subscriptions, something that was not the case 10 year ago.
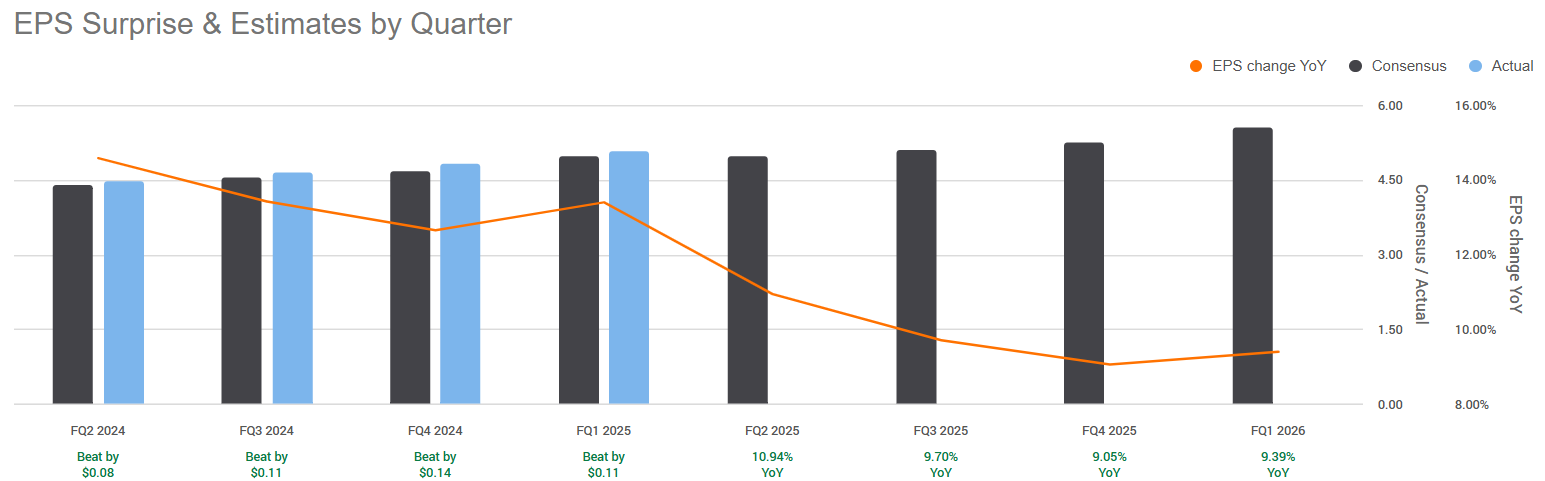
They have outperformed in all of their last 4 quarters (vs analyst expectations), and expect growth in all 4 upcoming quarters.
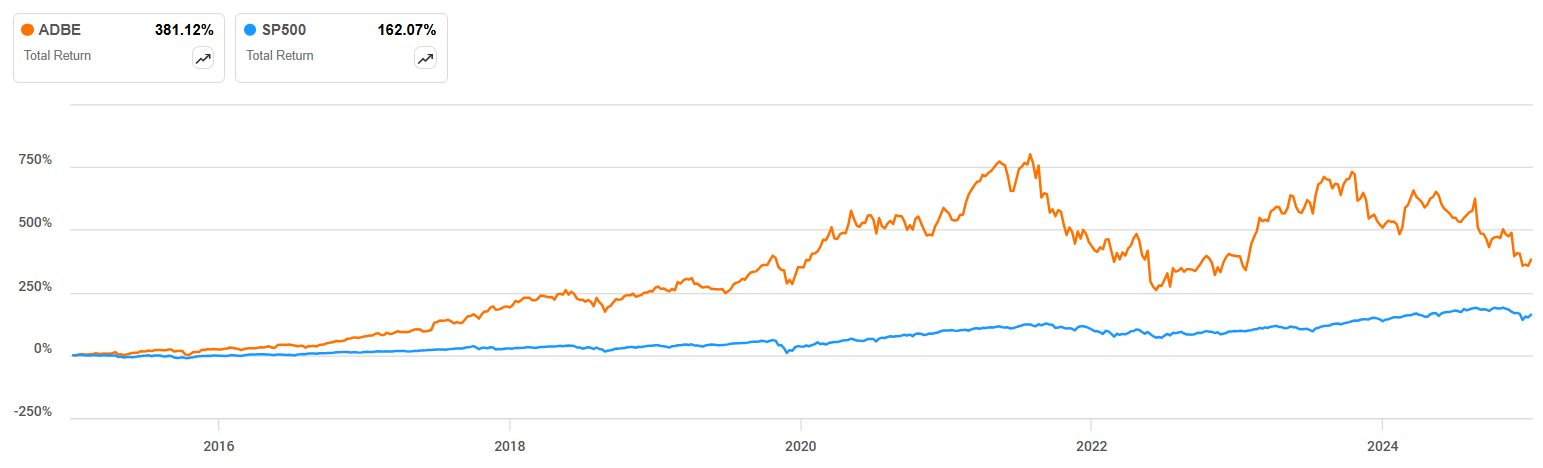
They have outperformed against the S&P 500 over the last 10Y.

They trade at their lowest valuation in over a decade!

ROIC looks very very good and has only been increasing with time, now sitting at 32%.

Free cash flow growth has been increasing at a fairly consistent rate over time.

They have also been buying back shares over the last 10Y.

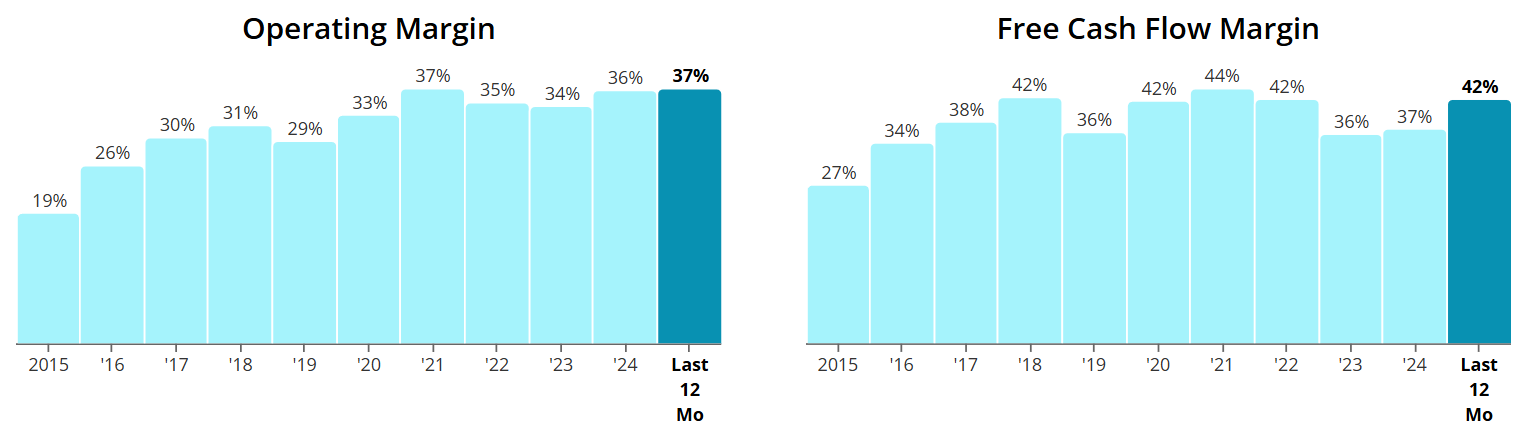
Both operating and free cash flow margin have been consistently healthy above the minimum levels and we note operating efficiency.
Net Debt to EBITDA sits at 0 and expected over the next 12 months to still be at 0, meaning it won’t take them even one day to pay off all of their debt, net of cash on hand.
Excellent balance sheet.

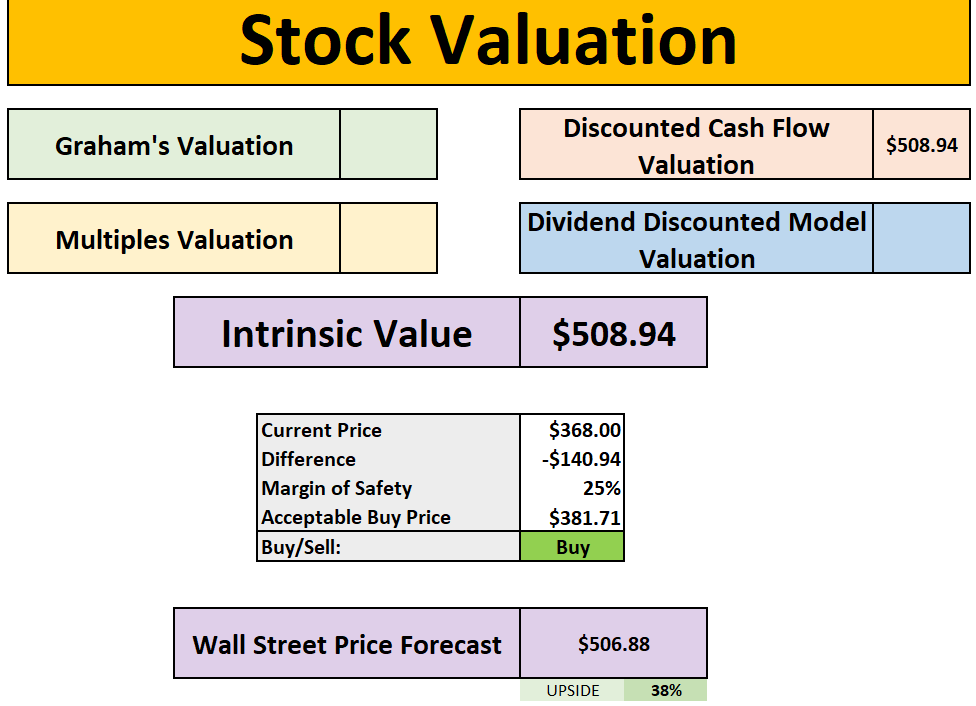
As per below, Wall Street see 38% upside over the next 12 months.

When we last ran it through our valuation model our intrinsic value came to $509 on a conservative growth rate:
As you can see below, the medium rate would yield $587.

So, in conclusion for ADBE, we see around a 25% margin of safety around the $382 mark with Wall Street indicating 38% upside - based on the conservative growth rate of 8%.
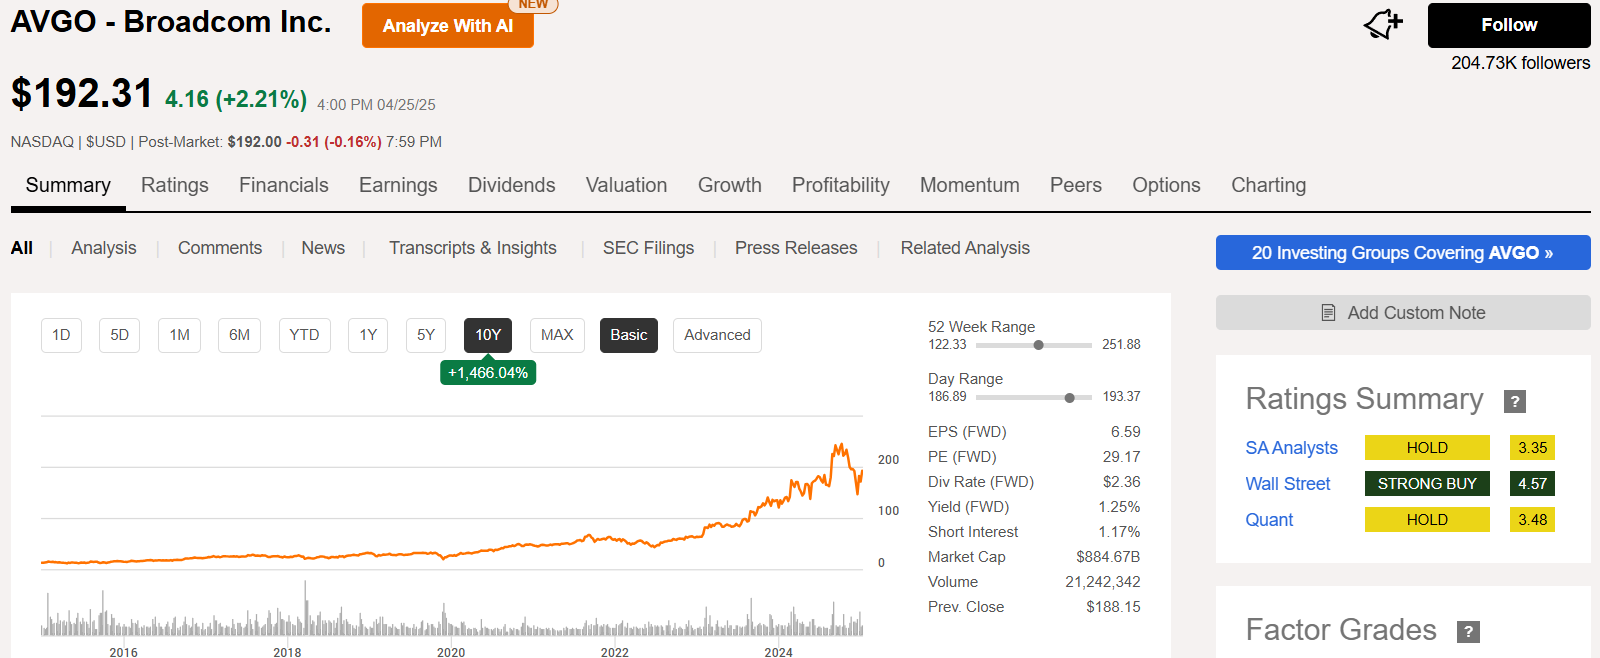
Broadcom (AVGO)
Broadcom designs and manufactures semiconductors and infrastructure software solutions.
Its products include chips for wireless communications, broadband, data centers, and enterprise software.
Broadcom serves a wide range of industries, including telecommunications, automotive, and cloud computing.

Broadcom's main income streams:
Semiconductors: Sales of chips for wireless communications, broadband, data centers, and networking.
Infrastructure Software: Enterprise software solutions for cloud, security, and mainframe environments.
Enterprise Storage: Storage-related products and solutions for data centers and enterprise clients.
Wireless & Broadband: Products for mobile devices, cable modems, and home networking equipment.


They have outperformed in all of their last 4 quarters (vs analyst expectations), and expect double-digit growth in all 4 upcoming quarters.

They have outperformed against the S&P 500 over the last 10Y.
Worth noting that their Forward P/E currently sits higher than their 5Y average.

ROIC is fairly inconsistent although sitting at 11%, bearing in mind this is a cyclical industry.

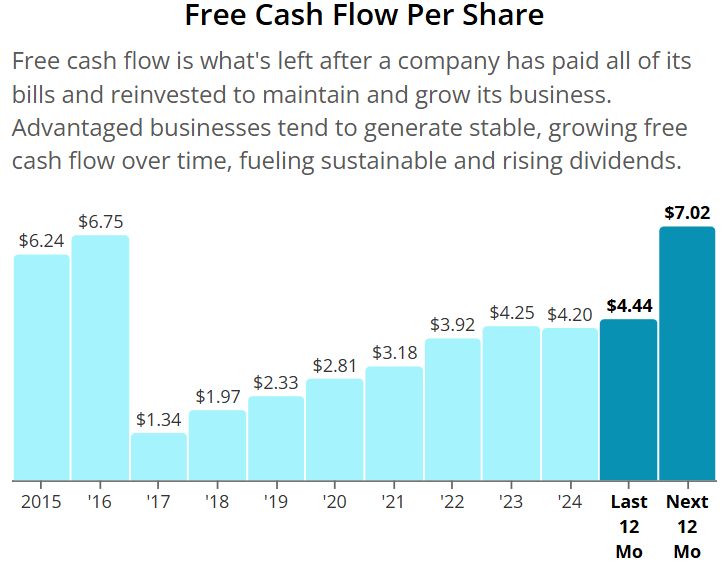
Free cash flow has been consistently rising since 2017 and expected to continue over the next 12 months.
Dividends have been increasing at a very fast double digit rate!

Margins look very strong on both accounts.

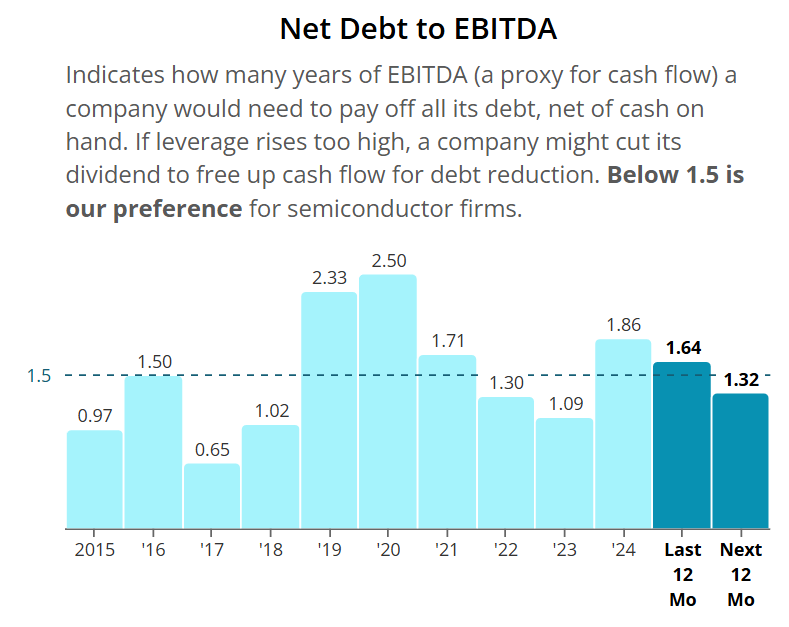
Net Debt to EBITDA sits at 1.64 and expected over the next 12 months to reduce to 1.32.
As per below, Wall Street see 27% upside over the next 12 months.

When we last ran it through our valuation model our intrinsic value came to $258:

So, in conclusion for AVGO, we see around a 25% margin of safety around the $194 mark with Wall Street indicating 27% upside.
Stock Resources
Stock Valuation Model 📊 (Unlock my stock valuation model as seen on YouTube)
Seeking Alpha 💵 ($30 off stock research tools I use daily.)
TipRanks 📈 (50% off expert stock research tools)
YouTube 🎥 (Join 89,000+ investors on YouTube!)
Patreon 👥 (Join my community for exclusive content)
Thanks For Reading!
☕ Buy Me A Coffee – Your support helps cover the costs of running the newsletter.
📬 Join the community – Subscribe now to get weekly investment insights delivered straight to your inbox.
💬 Found this helpful? Share it with friends and colleagues! Your support keeps this newsletter FREE.
I hope you all have a great week ahead! 🌟
Dividend Talks💰
Note:
I’m not a financial advisor. All content is for educational purposes only. Invest and trade at your own risk—I'm not responsible for any financial outcomes.