


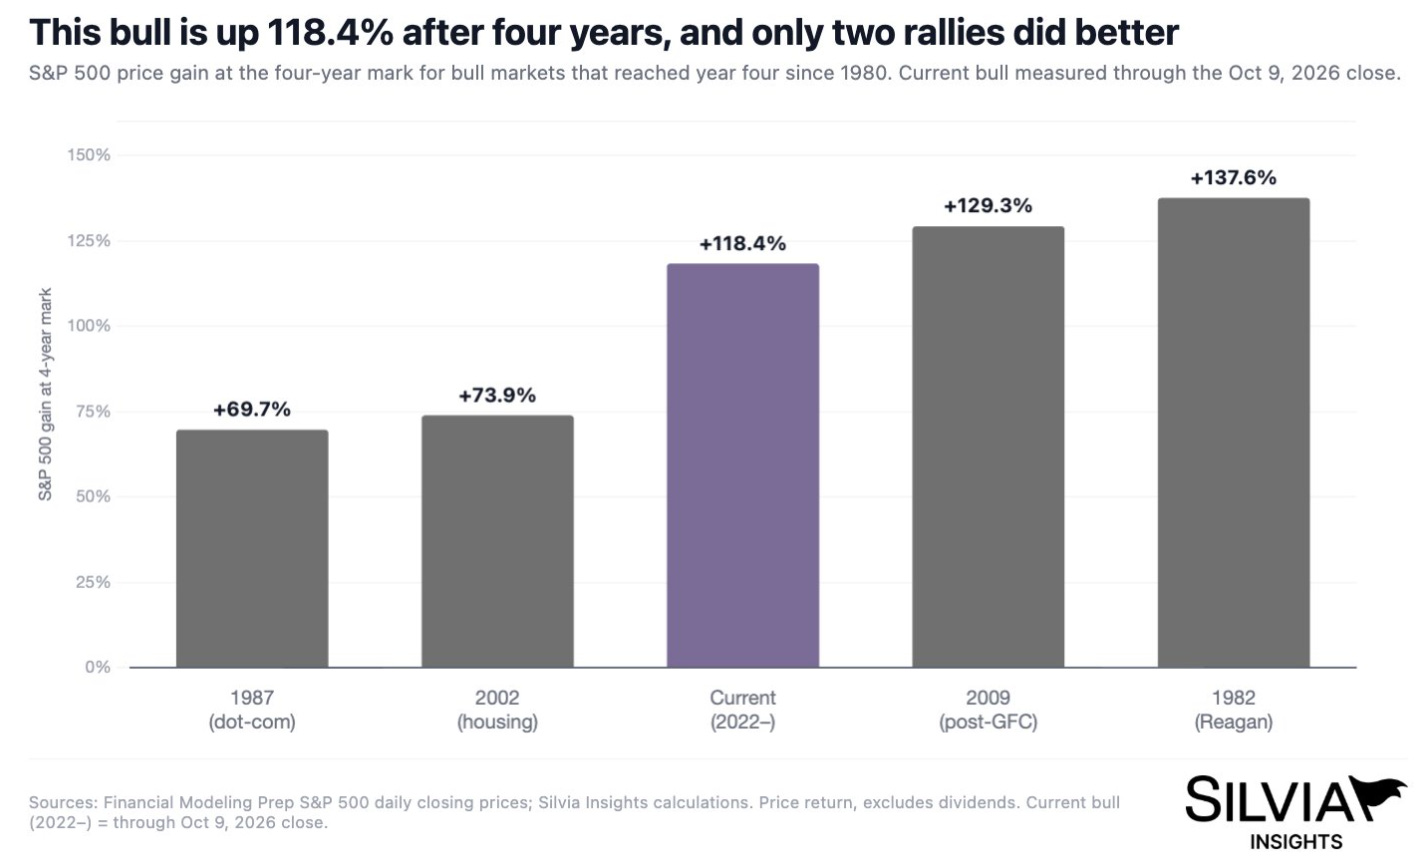
Four years ago today, the S&P 500 reached the low that became the starting point for this bull market.
Since then, the index has more than doubled. Investors who waited for inflation, interest rates, geopolitics and recession fears to stop being concerns have watched the market advance through all of them.
Yet that headline return tells us surprisingly little about the price of an individual business today. American Express has fallen around 20% from its 52-week high. Two other quality businesses on my Q4 shortlist have also suffered substantial declines, despite retaining attractive operating characteristics.
Those declines deserve investigation. They also raise a difficult question: are investors getting a better price on durable earnings, or are the earnings themselves becoming less dependable?
This week, I worked through three quality businesses to answer that question. I start with the market backdrop and a free look at American Express. Premium readers then receive the other two names, my complete ranking, the valuations and the prices at which I would consider putting fresh money to work.
The differences between their investment cases matter. One has a substantial valuation cushion even when I raise the discount rate. Another looks much more attractive if ambitious cash-flow forecasts arrive on schedule. The third sits between a strong business record and a less decisive valuation discount.
Four years of gains, with plenty to worry about
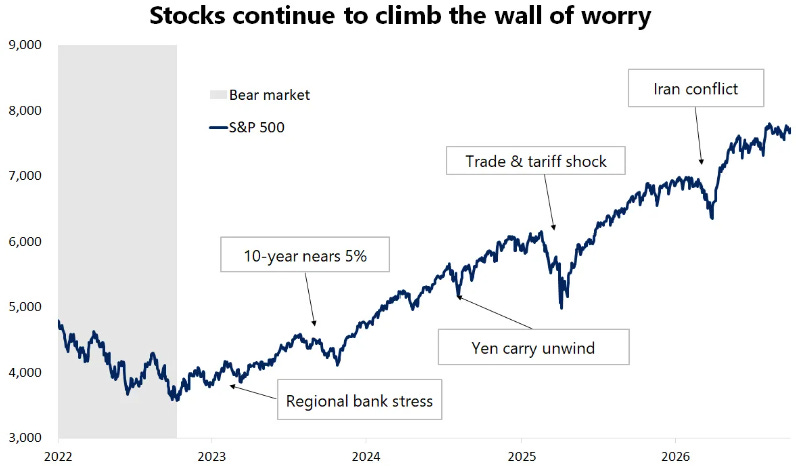
Stocks have advanced through banking stress, the yen carry-trade unwind, trade shocks and geopolitical uncertainty.
The recovery since October 2022 has repeatedly forced investors to reconsider what the economy could withstand. Higher borrowing costs weighed on housing and other rate-sensitive activities, but weakness in those areas did not prevent profitable businesses elsewhere from growing.
That is a useful lesson for Q4. Buying only when the news becomes reassuring can mean paying a considerably higher price. Equally, owning a business merely because it survived the previous shock says little about the return available from today’s valuation.
The age of the rally gives us context, rather than a timetable. Previous bull markets have lasted both substantially less and substantially more than four years. There is no expiry date that tells us when to sell, and no historical average that guarantees another year of gains.
What matters now is whether company profits can support the prices investors are paying.
Earnings are carrying more of the load
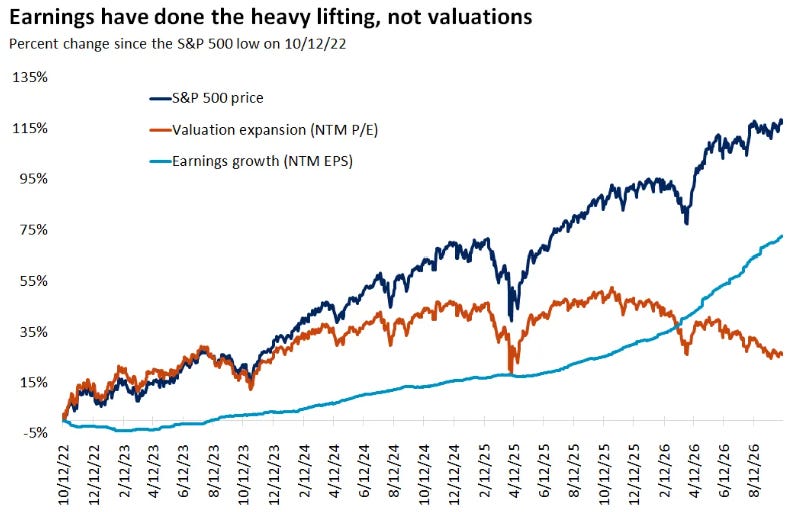
This chart compares index prices with next-12-month earnings expectations and the forward P/E multiple. Forward earnings are estimates, rather than profits already delivered.
This chart helps explain what has supported the rally. Earnings expectations have risen considerably since the 2022 low. More recently, the index has continued advancing while its forward valuation multiple has come down from earlier peaks.
That provides a stronger foundation than a rally driven entirely by investors paying more for the same earnings. It also creates a new responsibility for anyone buying: the earnings forecasts must be credible.
A falling forward P/E can reflect a lower share price, higher projected earnings, or a combination of both. If analysts raise their forecasts sharply, a stock can suddenly appear inexpensive before the underlying company has earned the money.
One company in this week’s shortlist makes this distinction particularly relevant. Its growth is impressive, but the valuation changes substantially depending on which future earnings period we use. I will show that difference in the company analysis.
The index is concealing very different outcomes
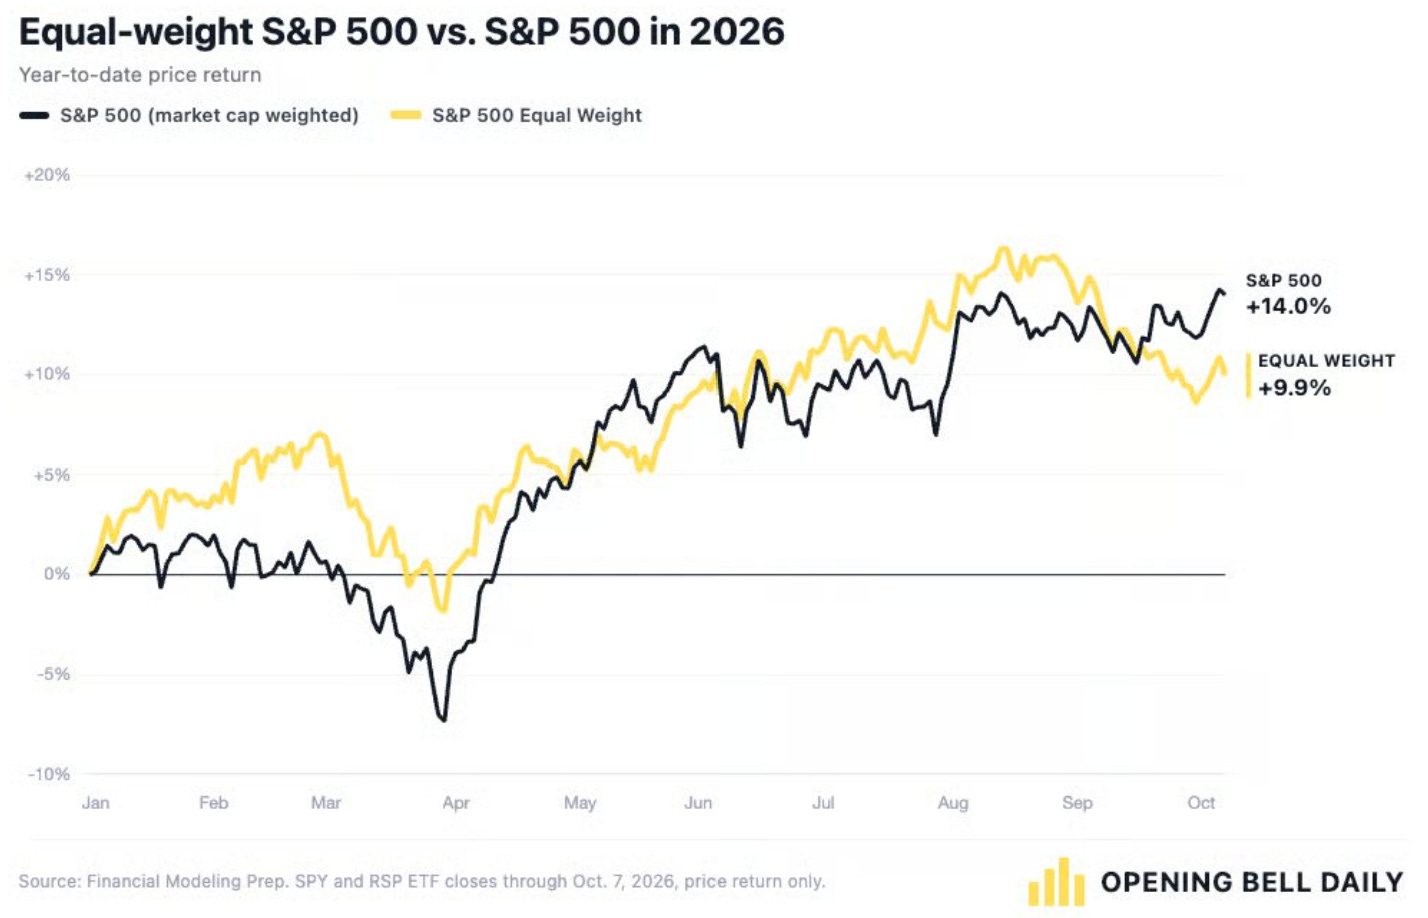
Through 7 October, this snapshot shows the cap-weighted S&P 500 up approximately 14%, versus 9.9% for the equal-weight version. Both figures are price returns.
The equal-weight index is still positive. That matters: weaker relative performance should not be confused with the average company collapsing.
However, the gap shows why we need to look beneath the headline. Large companies exert much more influence on the conventional S&P 500, so strength in a relatively small group can offset considerably weaker performance elsewhere.
S&P 500 Concentration — Top 10 Companies Account for 40% of the Index
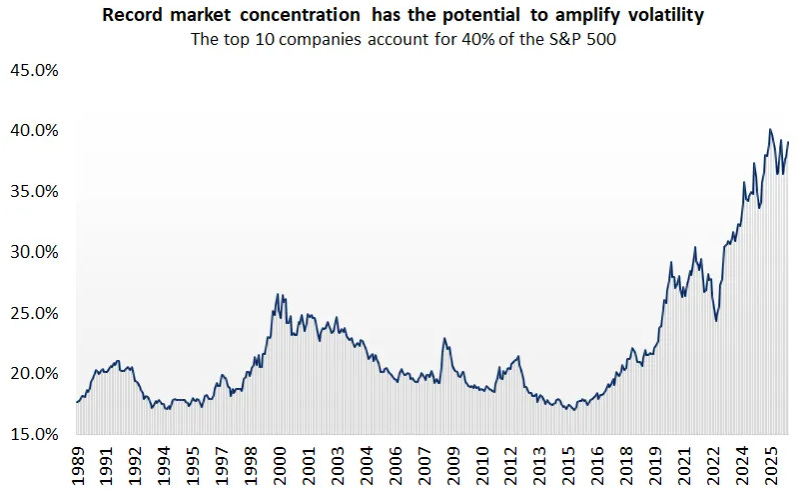
The ten largest companies account for approximately 40% of the index.
Concentration can be supported by exceptional businesses producing exceptional profits. It also means an index investor’s results are increasingly sensitive to whether those leaders meet expectations.
For individual-stock research, this creates opportunities and traps. A neglected company may offer a better prospective return than a market favourite. A company falling behind may also have a deteriorating business model that deserves a lower valuation.
The practical response is to examine growth, profitability and price together. I want evidence that the business remains attractive and that enough uncertainty has been reflected in the entry price.
Higher rates make the valuation hurdle more demanding
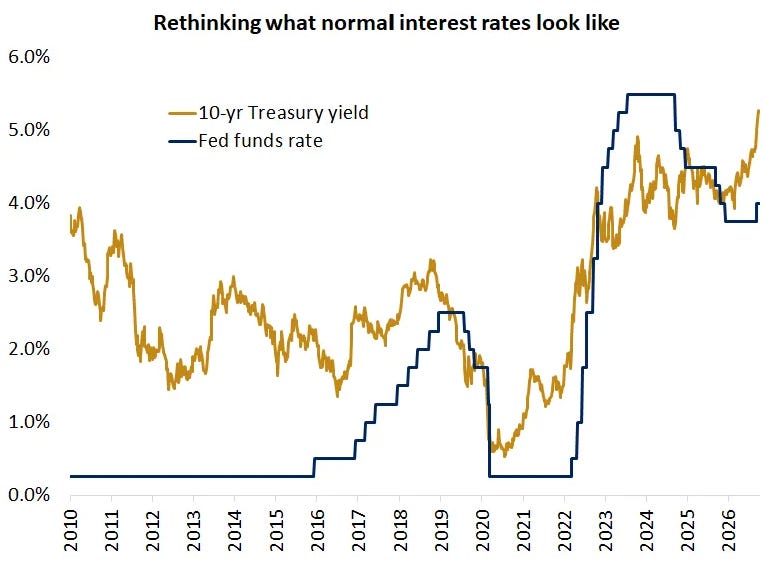
Long-term borrowing costs remain elevated compared with much of the 2010s.
Interest rates affect both business performance and valuation. Consumers face more expensive borrowing. Companies pay more to refinance debt. Investors have a stronger alternative to accepting equity risk for a modest potential return.
The latest available Federal Reserve data put the 10-year Treasury yield above 5%. That does not automatically rule out buying stocks. It does mean that the return we require from uncertain future cash flows needs careful thought.
The effect is particularly large in a DCF model, where a substantial portion of value may come from cash generated many years from now. Increasing the discount rate by a percentage point can change the result far more than a small adjustment to next quarter’s revenue.
For one company in the shortlist, I increased the model’s discount rate to 9%. For another, I tested an 8% case against 9% and 10% alternatives. Those comparisons help distinguish an attractive business from an attractive investment at a particular required return.
A market near highs can still contain meaningful drawdowns
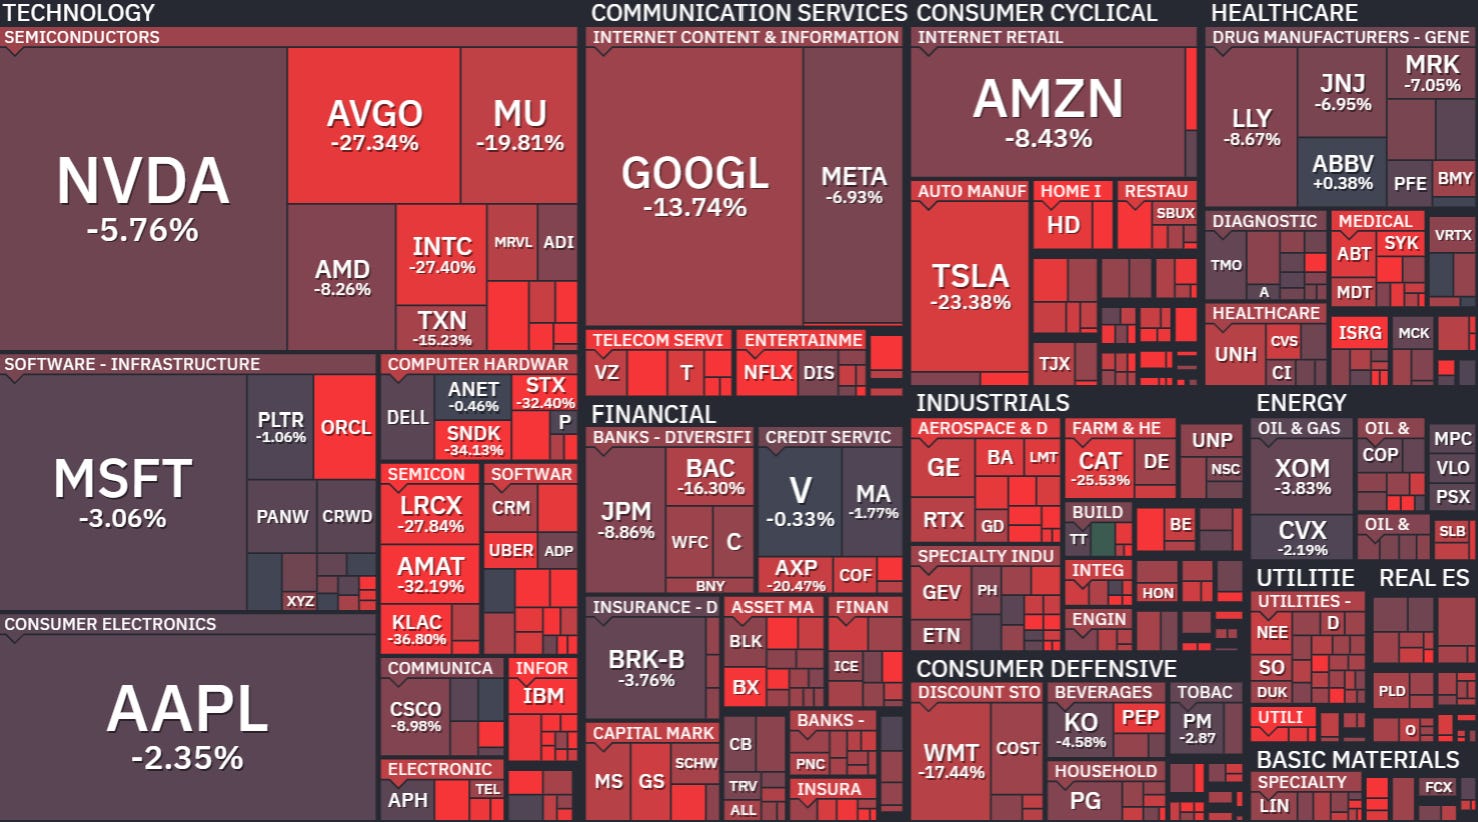
This heatmap measures distance below each company's own 52-week high.
The contrast is clear. Some large companies remain close to their highs, while others have lost a fifth, a quarter or more of their value.
I use that information to decide where to investigate. A drawdown alone cannot tell me what a stock is worth. The previous peak might itself have been too expensive, and a lower price can be justified by lower future earnings.
My checklist for these three businesses is therefore straightforward: understand why the discount exists, assess the earnings and cash flows behind the valuation, and test what happens if the optimistic assumptions fail.
That leads naturally to American Express.
A first look at American Express
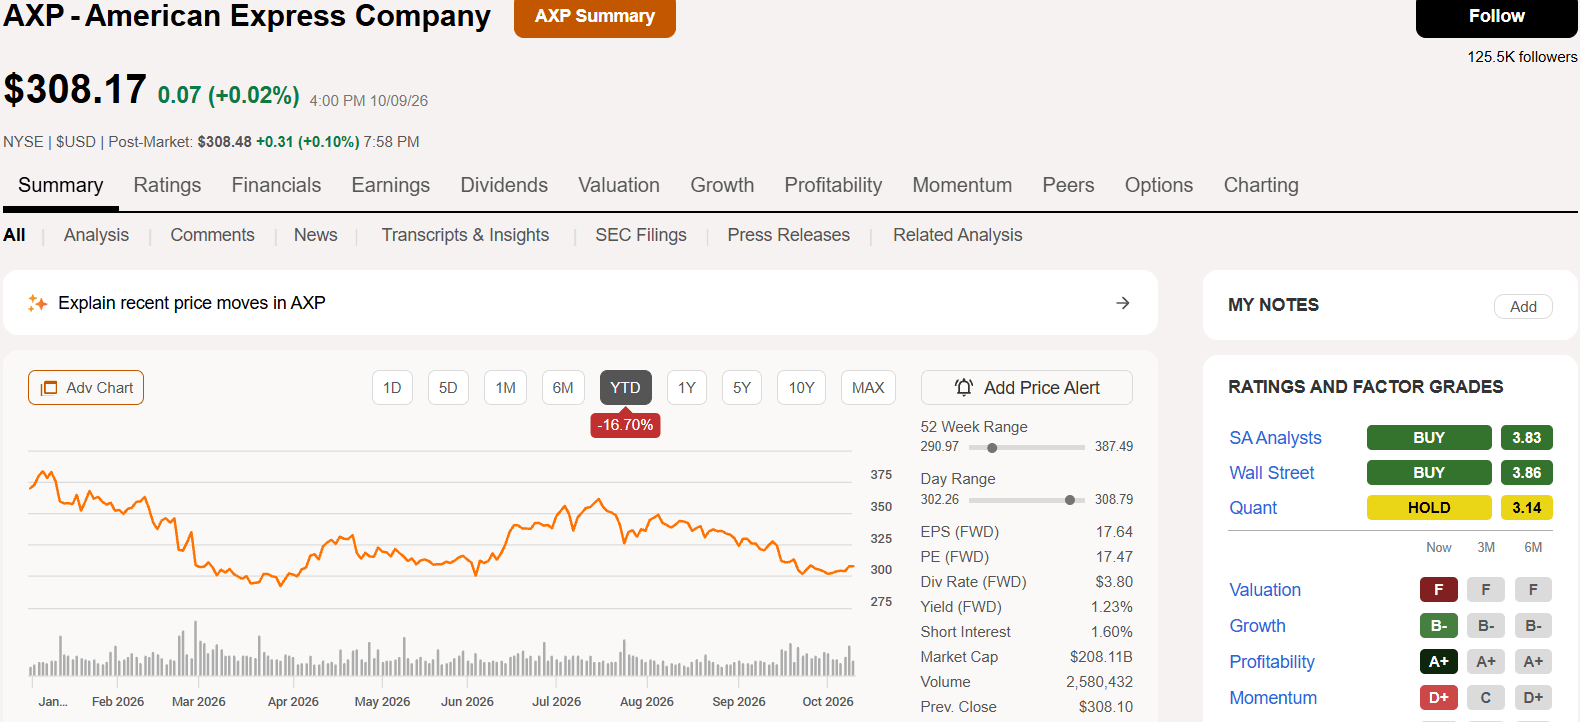
Amex is interesting because its customer relationships extend beyond processing a transaction. It earns merchant revenue, card fees and lending income, while spending heavily on rewards and benefits that help attract and retain customers.
The latest published quarter shows continued momentum: revenue net of interest expense grew 10%, cardmember spending grew 9%, and EPS increased 11%. Management’s 2026 EPS guidance remains $17.30–$17.90.
The customer proposition also appears to be supporting a higher fee base.
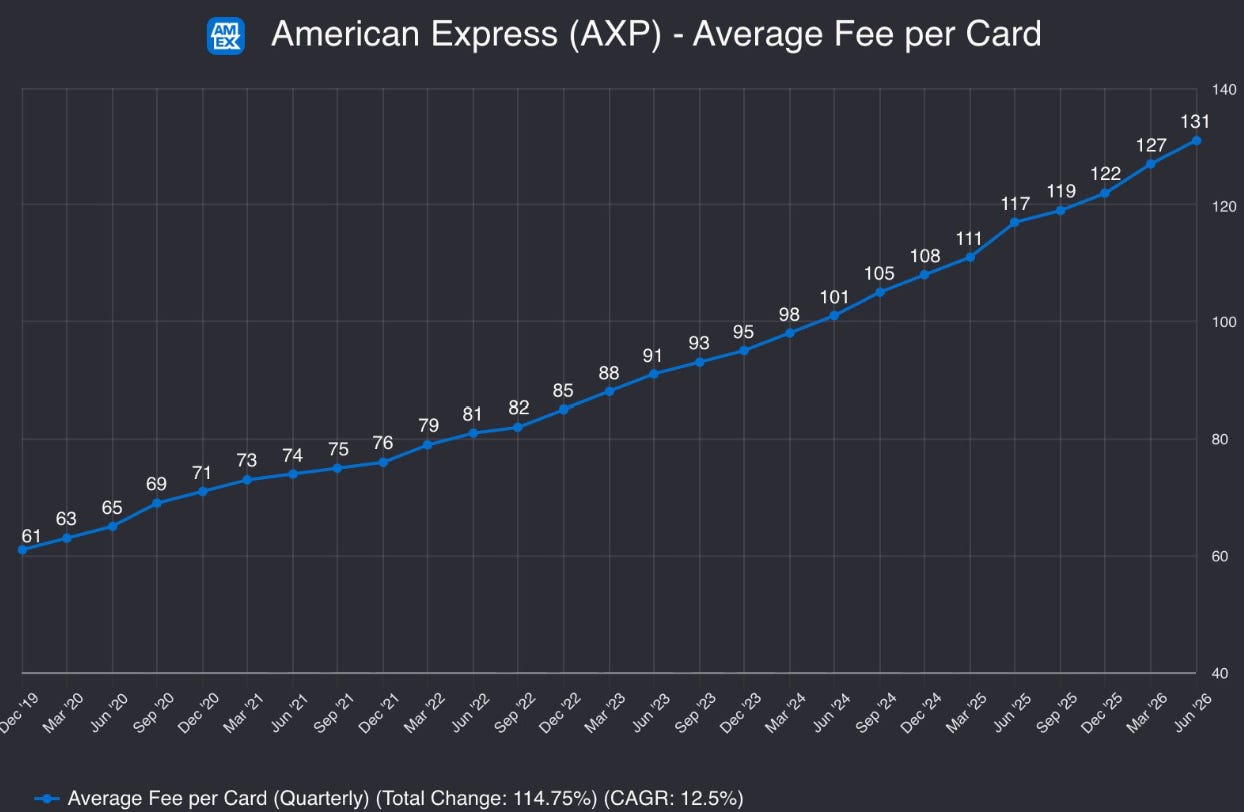
That increase reflects pricing and the mix of cards customers hold. It is encouraging, but the net economics matter: higher fees need to exceed the additional costs of benefits, rewards and servicing those relationships.
There is a valuation distinction worth keeping in mind. The Simply Safe Dividends snapshot puts Amex at 16.6 times forward earnings, versus a five-year average of 17.7. That is a modest discount, even though the share-price decline looks substantial.
This is where the research becomes more valuable. How much growth is reasonable to expect? How much credit risk should we allow for? And what price leaves enough room for disappointment?
My ranking and the prices I would pay
American Express is not my top-ranked opportunity this week.
One of the other businesses is already below my preferred entry price, and its model retains a meaningful valuation cushion when I raise the discount rate to 10%. The other has exceptional growth, but its apparent discount changes dramatically when I demand a higher return.
Below, Premium readers receive:
The other two stocks and my final ranking of all three.
The valuations, growth assumptions and sensitivity tests behind each case.
My preferred entry prices and which opportunity I would prioritise now.
The business risks and upcoming evidence that could change my view.
If you are deciding where to put fresh money, upgrade to read the complete comparison and action plan.