

The most useful question after a sharp selloff is: how much has the investment case changed relative to the share price?
A business can keep growing while its shares fall because investors previously expected even more. A large decline can also reflect a lasting problem that deserves a lower valuation.
Both possibilities matter in this AI selloff.
Before getting to the three stock analyses, let’s examine where the damage is, why investors are nervous, and what would give me confidence to call a falling stock an opportunity.
The market is splitting in two
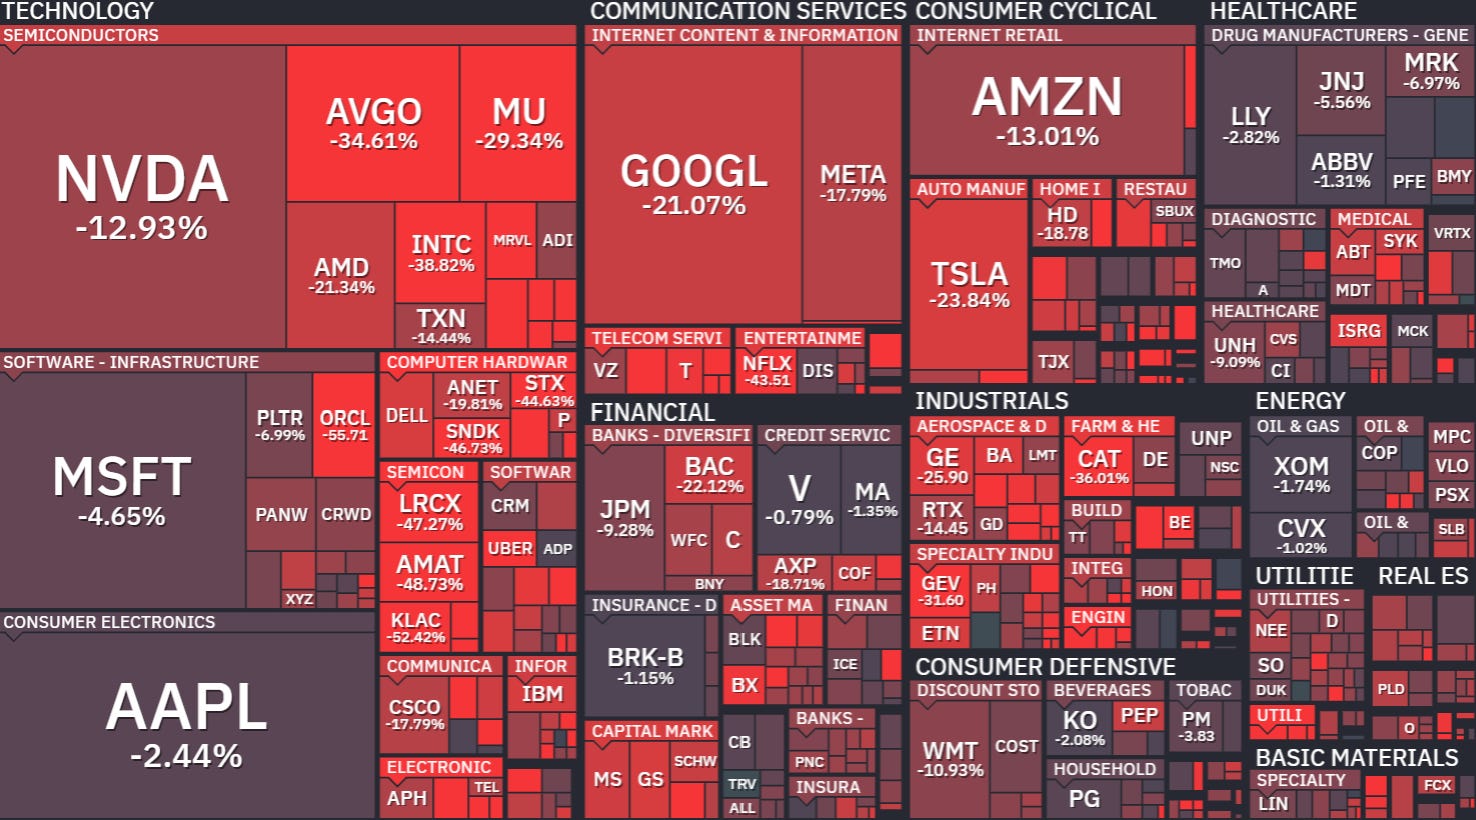
Broadcom is 35% below its 52-week high, Alphabet around 21% below, and Nvidia roughly 13% below.
Those are drawdowns from each company’s high. They show how differently the market has treated businesses associated with the same AI theme.
The size of the decline is a starting point. What matters next is whether future earnings and cash flow have deteriorated by enough to justify it.
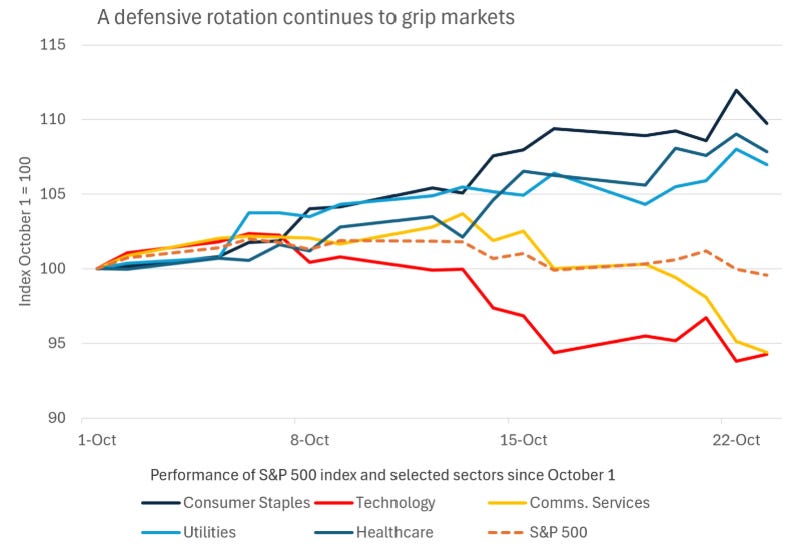
The rotation chart adds another piece: technology and communication services have weakened while consumer staples, utilities and healthcare have risen.
That helps explain why the headline index can look relatively calm while individual portfolios feel considerably worse.
It also makes indiscriminate buying difficult. The market is reassessing which businesses deserve a premium, and investors seeking shelter can push defensive shares to demanding valuations too.
My approach is to compare the price with the business underneath it, wherever that business sits.
Inflation is still part of the story
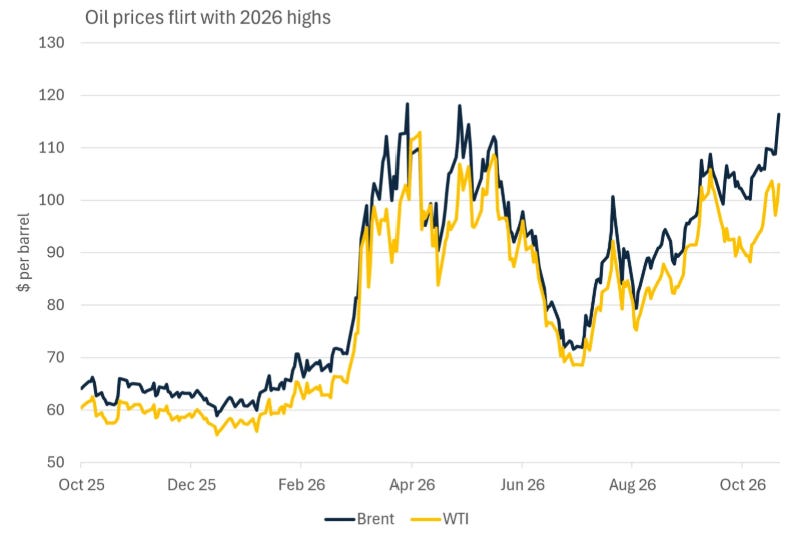
Oil belongs in this discussion because it can affect both corporate profits and the interest-rate outlook.
A sustained rise raises costs for transport and other energy-intensive activities. It can also squeeze household spending as more income goes towards fuel and essentials.
Businesses differ in how easily they can pass those costs on. For a valuation, that means testing margins and demand alongside revenue growth.
The key question is how much pressure persists long enough to change the cash a company can generate.
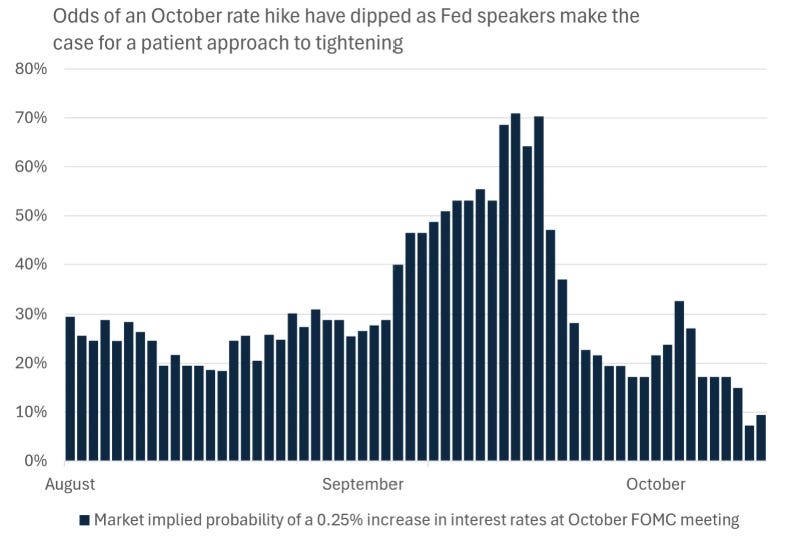
The chart shows a substantial retreat in the implied chance of an October rate increase, from around 70% in September to below 10% at its latest observation.
That eases one immediate concern. A pause would still leave borrowing costs elevated, however, and future decisions would depend on inflation and economic activity.
I would therefore build a valuation that can withstand a less helpful interest-rate environment. A thesis that requires rapid monetary easing leaves little room for disappointment.
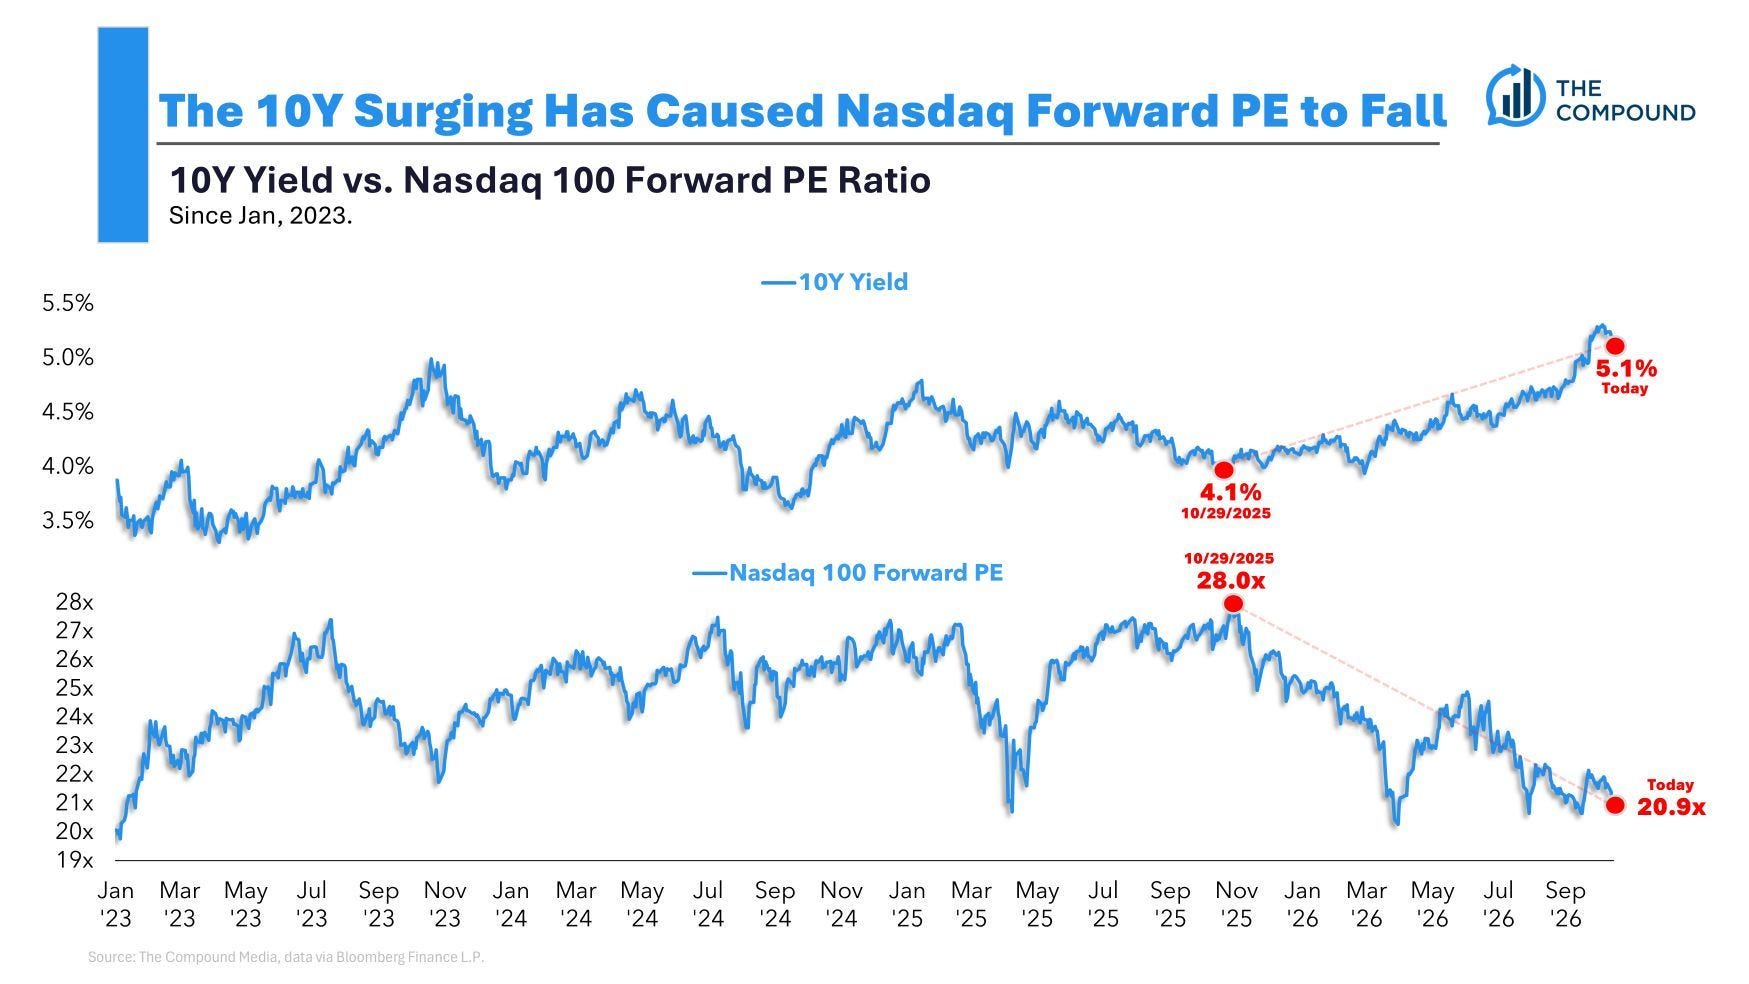
The chart pairs elevated Treasury yields with a lower forward earnings multiple for the Nasdaq 100. It illustrates one pressure on growth-stock valuations.
When investors can earn more from bonds, they may demand a higher prospective return from shares. Higher discount rates also reduce the present value of cash expected years into the future.
For an AI business whose investment case depends heavily on future growth, that can materially change what I am willing to pay.
Growth assumptions and the required return need to work together. Strong forecasts alone cannot settle the valuation.
The AI spending bill is becoming harder to ignore
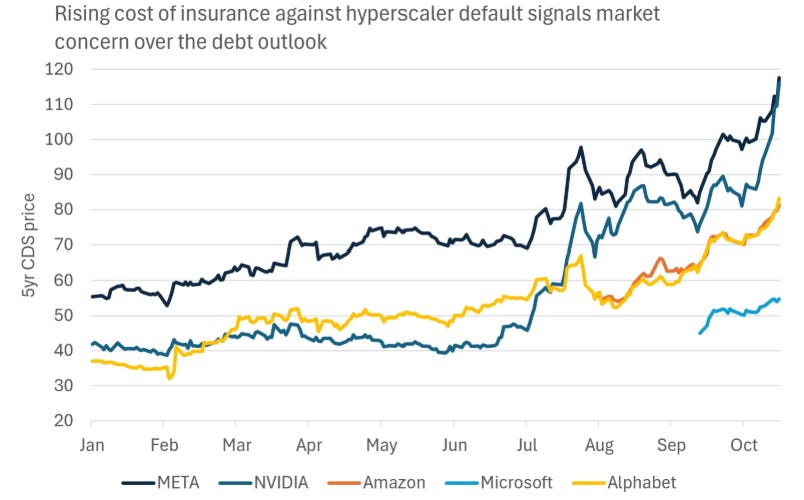
A credit default swap provides protection against a borrower defaulting. Rising protection costs indicate greater concern in the credit market, although pricing also reflects liquidity and demand for hedges.
For shareholders, the useful question is how a company would finance its commitments if conditions became less favourable.
I want to understand its existing cash generation, debt maturities, borrowing needs and flexibility to adjust spending. Those factors help distinguish a manageable investment programme from one that could become painful for shareholders.
A profitable supplier and a heavily financed infrastructure operator can have very different exposures to the same spending cycle.
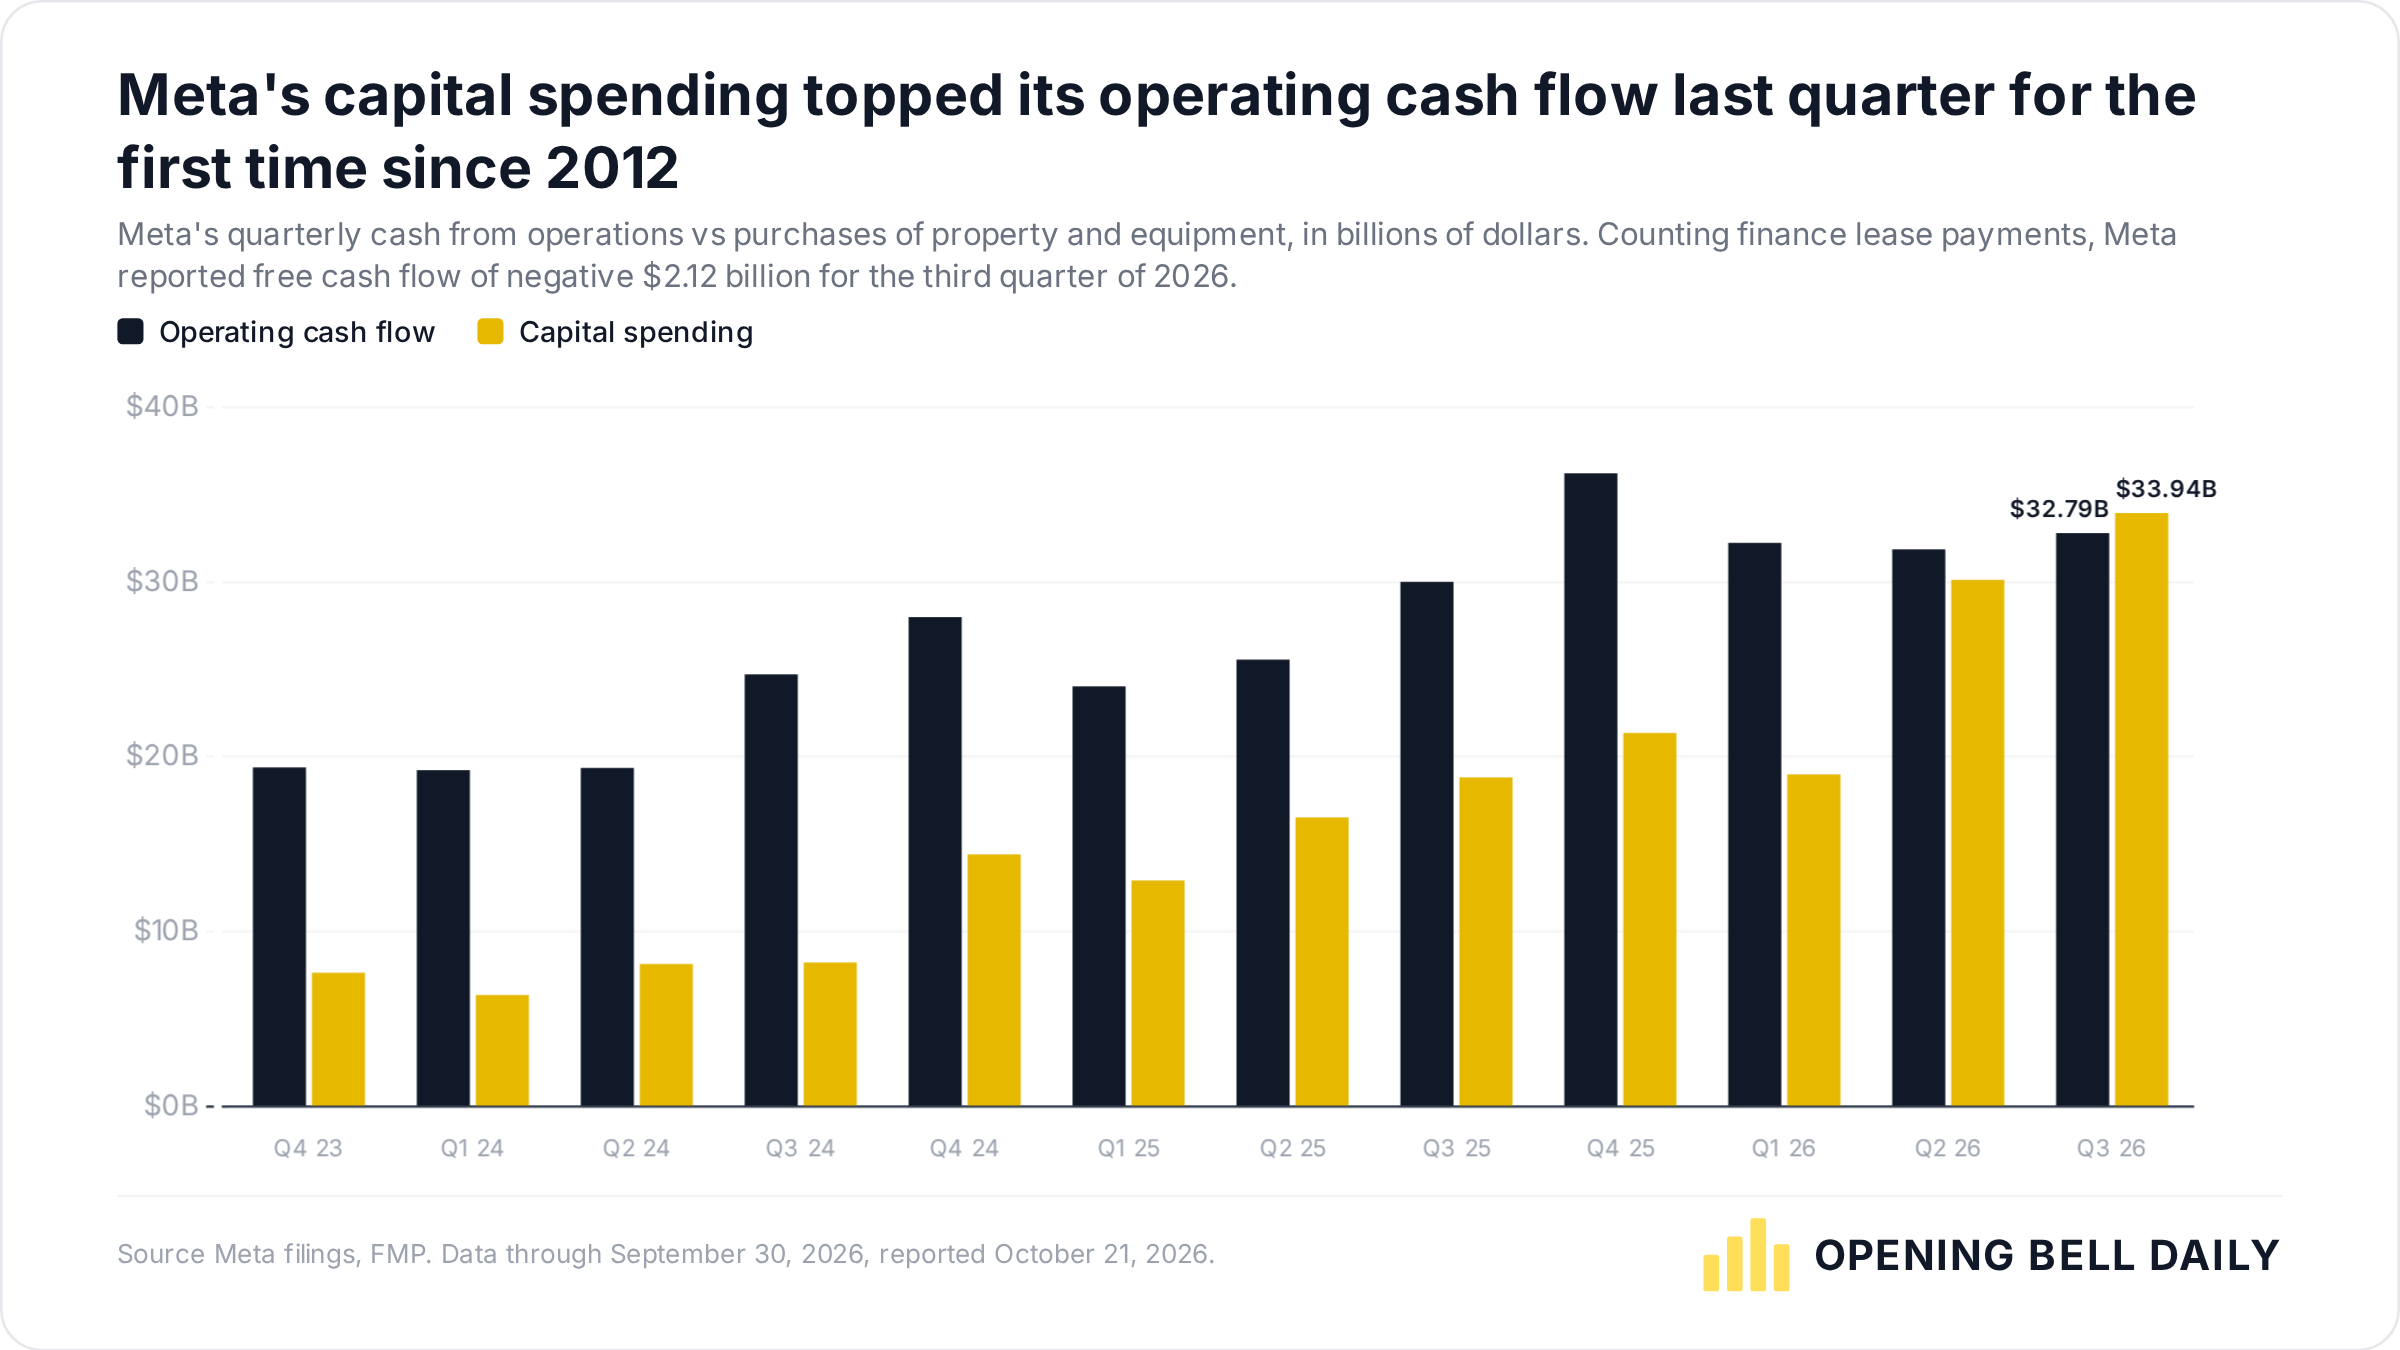
Meta provides a concrete example of why cash flow deserves attention.
In its latest quarter, operating cash flow was $32.79 billion. Capital expenditure, including finance-lease principal payments, was $34.91 billion, leaving reported free cash flow of negative $2.12 billion.
That is a substantial operating cash engine alongside an even larger investment bill. The chart’s spending bars exclude finance-lease principal payments; the free-cash-flow figure includes them.
The valuation question becomes how much cash that investment can produce later, and how much further spending will be needed. A convincing case should explain both.
Where lower prices could become interesting
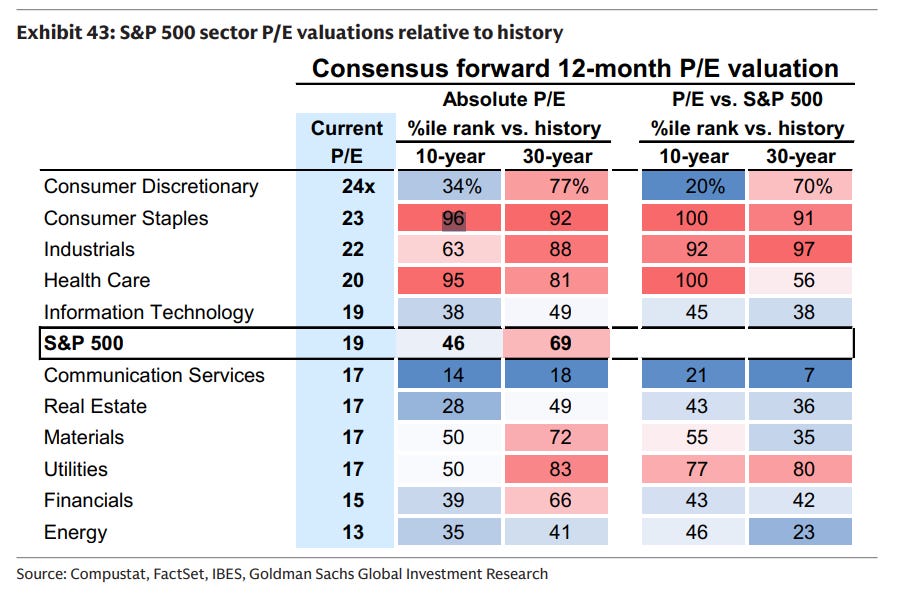
The table puts information technology at roughly 19 times forward earnings, communication services at 17 times, and consumer staples at 23 times.
Its historical comparisons also show how far apart the sectors sit relative to their own past valuations.
That gives us areas worth investigating. Individual companies still require their own assessment: sector averages combine different business models, growth rates and risks, while earnings estimates can change.
A lower multiple becomes useful when the underlying earnings prove durable. That is why I want to examine what each company would earn under a slower-growth scenario before treating the apparent discount as attractive.
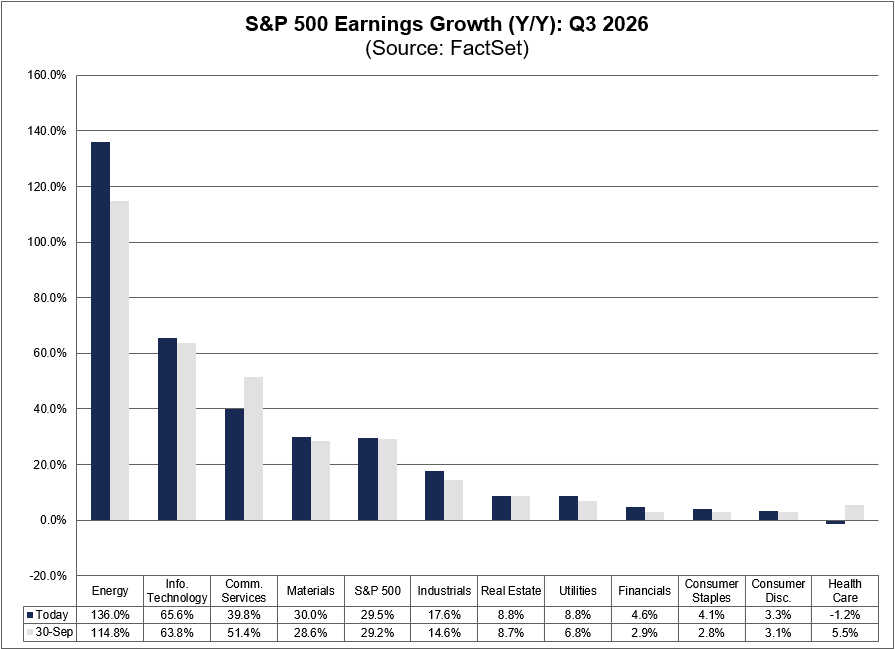
There is still substantial earnings growth in the picture.
FactSet’s 23 October update put blended S&P 500 earnings growth at 29.5%. “Blended” combines reported results with estimates for companies yet to report. Ten of eleven sectors showed year-on-year growth.
Among companies that had reported, 83% beat EPS estimates, but the aggregate beat was 2.1%, below recent historical averages.
Those figures support a more selective assessment. Corporate profits have continued growing, while the strength and sustainability of that growth vary considerably.
The task is to identify which expectations look achievable at today’s price, with enough room for a less favourable outcome.
This week will test the assumptions
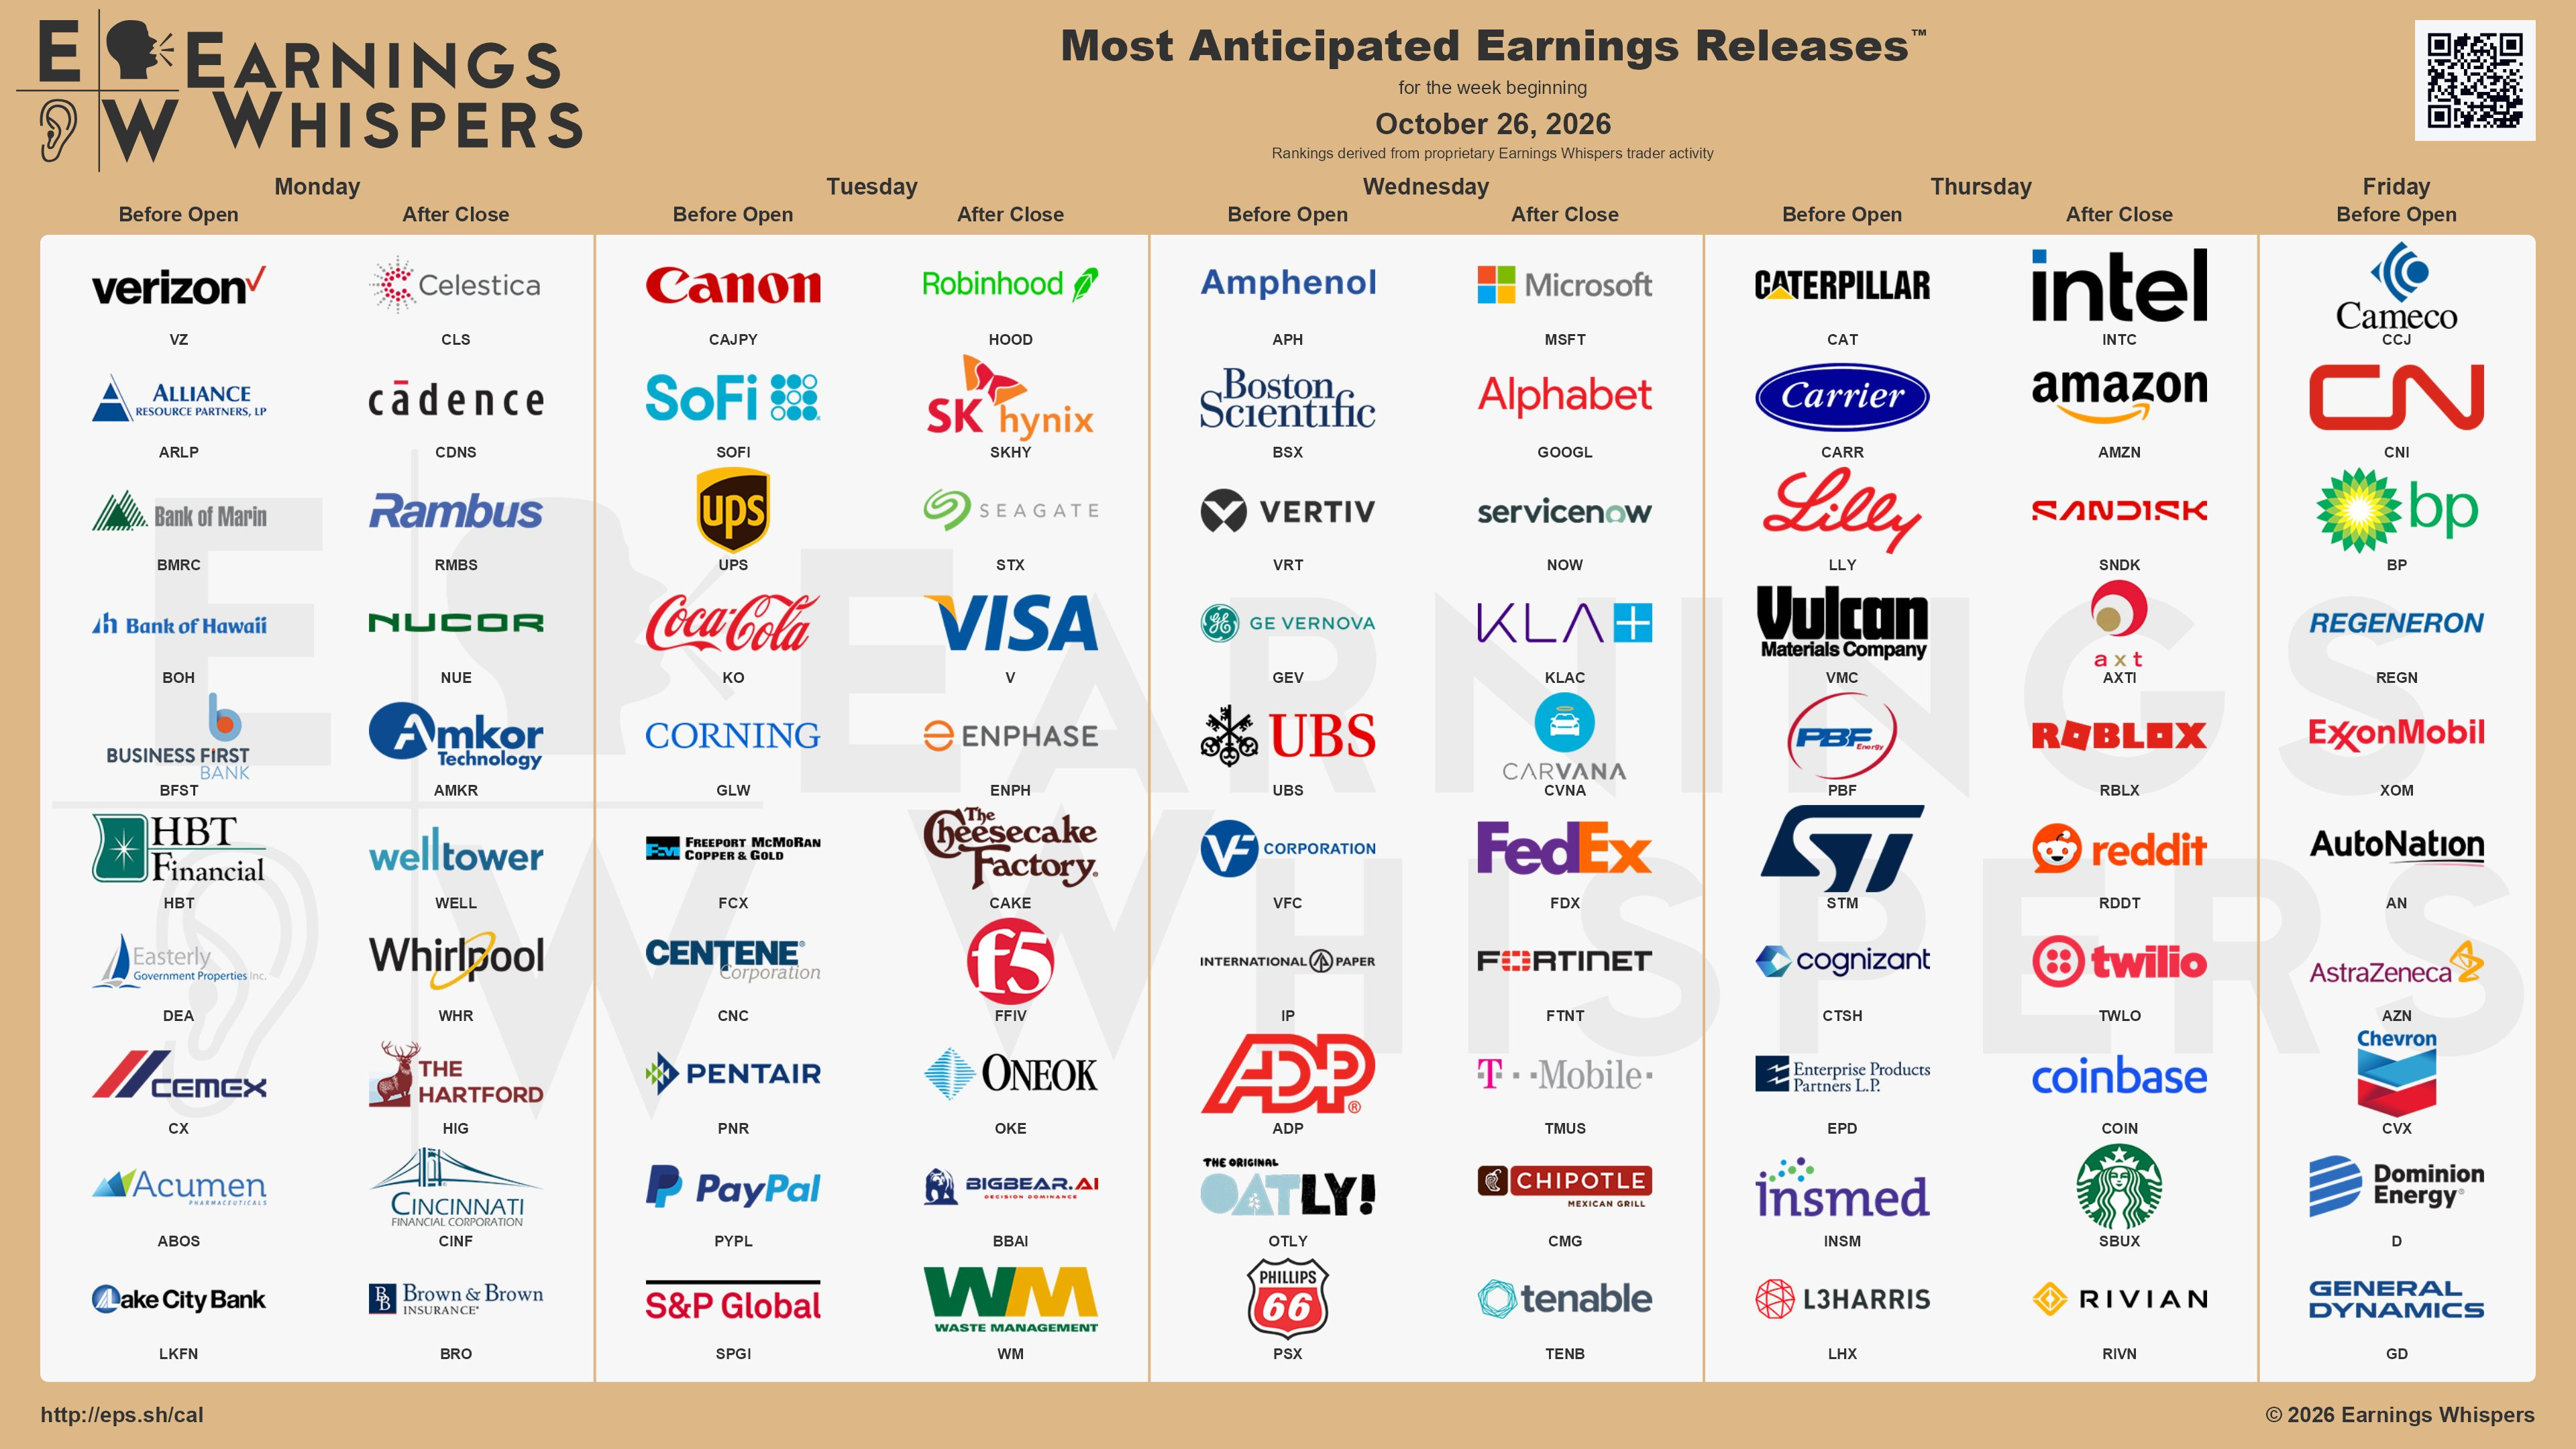
The calendar brings those questions into focus, with Microsoft, Alphabet and Amazon among the companies reporting this week.
I will be looking for evidence of demand turning into revenue, the spending required to serve it, and the cash left over. Guidance on future investment will matter alongside the latest quarter’s results.
For suppliers, I want to understand customer concentration and how resilient orders would be if investment plans slowed. For the companies buying the infrastructure, I want evidence that the spending can generate attractive returns.
The same AI theme can produce very different investment outcomes.
How I’m approaching the opportunity
My assessment is that this selloff warrants fresh research into the strongest businesses at their lower prices.
I want three things to line up: a business that can fund its plans, growth assumptions that allow for disappointment, and a valuation that offers an attractive return under those assumptions.
That also means being willing to wait when a good company still requires too much optimism.
The next step is to apply those tests to individual stocks and show the working.
In the paid section, I’ll compare three stocks, explain my fair-value estimates and buy-below prices, and test the downside scenarios that could change the conclusions.
If you would like the full stock analysis, final ranking and valuations, upgrade to paid below. Thank you to everyone whose subscription supports this research.