
3 Stocks to Buy After the Earnings Crash
Market reactions create buying opportunities in high-quality stocks after earnings disappointments

Most investors don’t lose money by picking bad companies - they lose it by overpaying for great ones.
I built a valuation system to answer one question every week:
👉 What’s actually worth buying *now* - and what only looks attractive?
Paid members get the same tools I use to size risk, find upside, and avoid value traps.
Each month, members receive:
📊 Undervalued Dividend Dashboard - A live spreadsheet ranking income stocks by valuation, yield safety, and margin of safety (released on the 1st).
🚀 High-Upside S&P 500 Valuations - Market leaders scored by upside, downside risk, and exact buy zones (released on the 15th).
🧠 Weekly Buy / Hold / Avoid analysis - Clear decisions - not just commentary - tied directly to articles like this one.
Free readers get the story.
Paid readers get the numbers, the risk, and the decision.
Over 130,000 investors follow my work across YouTube and Substack, using these models to manage real portfolios - not paper ideas.
This market is starting to punish expectations instead of bad businesses.
We’re seeing a pattern: strong companies beat earnings - and still sell off. Not because the business is broken, but because valuation, spending, and guidance collide with investor psychology.
That’s where opportunity lives.
In today’s report, I’m breaking down three post-earnings selloffs where the market reaction looks disconnected from long-term fundamentals - and where valuation is quietly resetting risk and reward.
But first, here’s what changed in the market this week.
Market Update
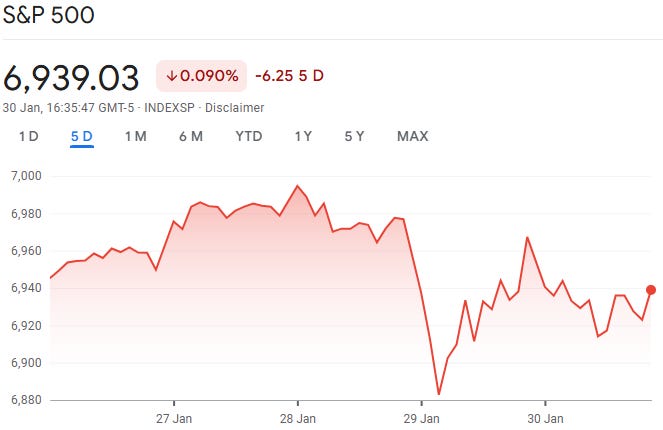
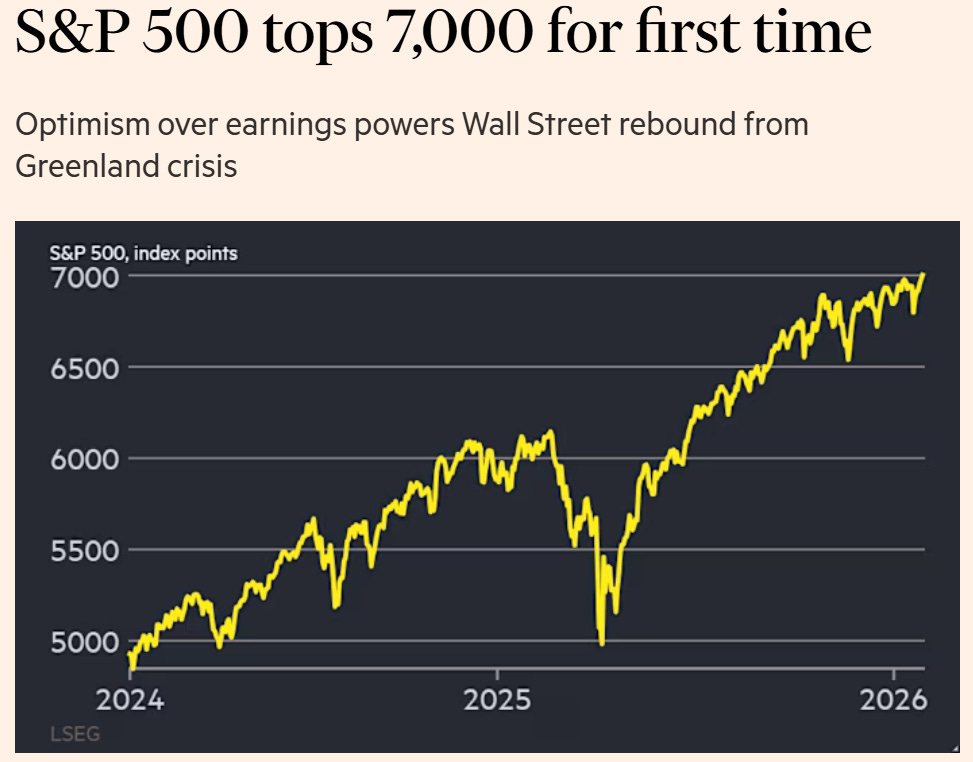
The market flirted with a milestone this week - and then thought better of it.
The S&P 500 briefly pushed past the 7,000 mark, setting a new intraday high before momentum faded and prices slipped back. The move felt symbolic: optimism was there, but conviction wasn’t. Beneath the surface, leadership narrowed. Large-cap value stocks quietly outperformed their growth peers, while small- and mid-cap names struggled to keep up, ending the week in the red. Within the S&P 500, communication services and energy did the heavy lifting, while health care stocks were the biggest drag.
Away from equities, the economic backdrop grew more complicated.
Consumer confidence took a sharp turn lower in January. The Conference Board’s index fell to 84.5, down from 94.2 in December and its lowest reading since May 2014. The drop was steeper than expected and reflected growing unease about both the economy and the labor market. Households, it seems, are feeling less secure - even as headline economic data remains relatively firm.

The labor market itself sent mixed signals. Initial jobless claims edged down slightly to 209,000 for the week ended January 24, still hovering near historically low levels. Continuing claims fell to roughly 1.83 million, the lowest since September 2024, suggesting that workers who lose jobs are still finding new ones relatively quickly.

On the manufacturing front, delayed data finally offered a positive surprise. Durable goods orders rebounded sharply in November, rising 5.3% after a decline in October. Core capital goods orders - a key proxy for business investment - also moved higher, climbing 0.7%.

At the same time, inflation pressures at the producer level showed signs of re-accelerating. Producer prices rose 0.5% in December, well above expectations, driven largely by higher service prices and widening margins for wholesalers and retailers.

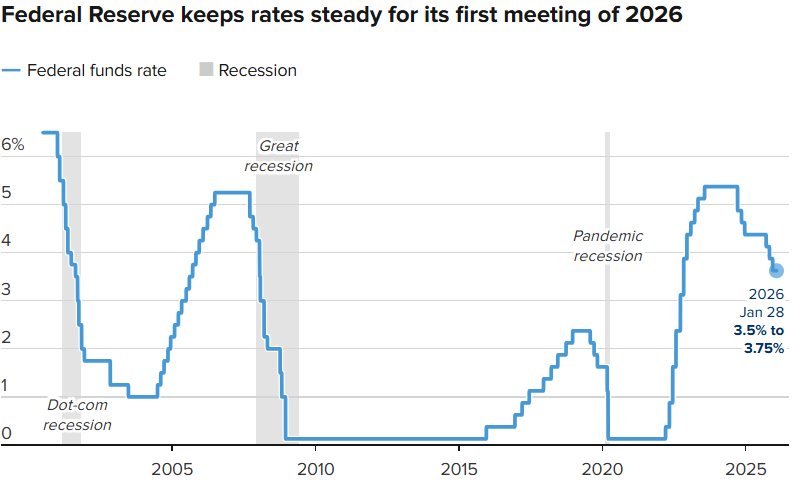
That inflation backdrop helped frame the Federal Reserve’s latest decision. After three consecutive rate cuts, the Fed hit pause, holding its benchmark rate steady in the 3.50%–3.75% range. While two policymakers dissented in favor of another cut, the majority pointed to an economy that continues to expand at a “solid pace.” Chair Jerome Powell emphasized that rates no longer appear “significantly restrictive” and reinforced that future moves will be decided meeting by meeting.
Adding another layer of uncertainty, President Trump announced the nomination of former Fed Governor Kevin Warsh to succeed Powell when his term ends in May, pending Senate confirmation - raising fresh questions about the future direction of U.S. monetary policy.
For now, markets are left balancing optimism about growth with lingering concerns about inflation, policy, and the consumer. The S&P 500 may have touched 7,000 - but whether it’s ready to stay there remains an open question.
Last Weeks Winners & Losers
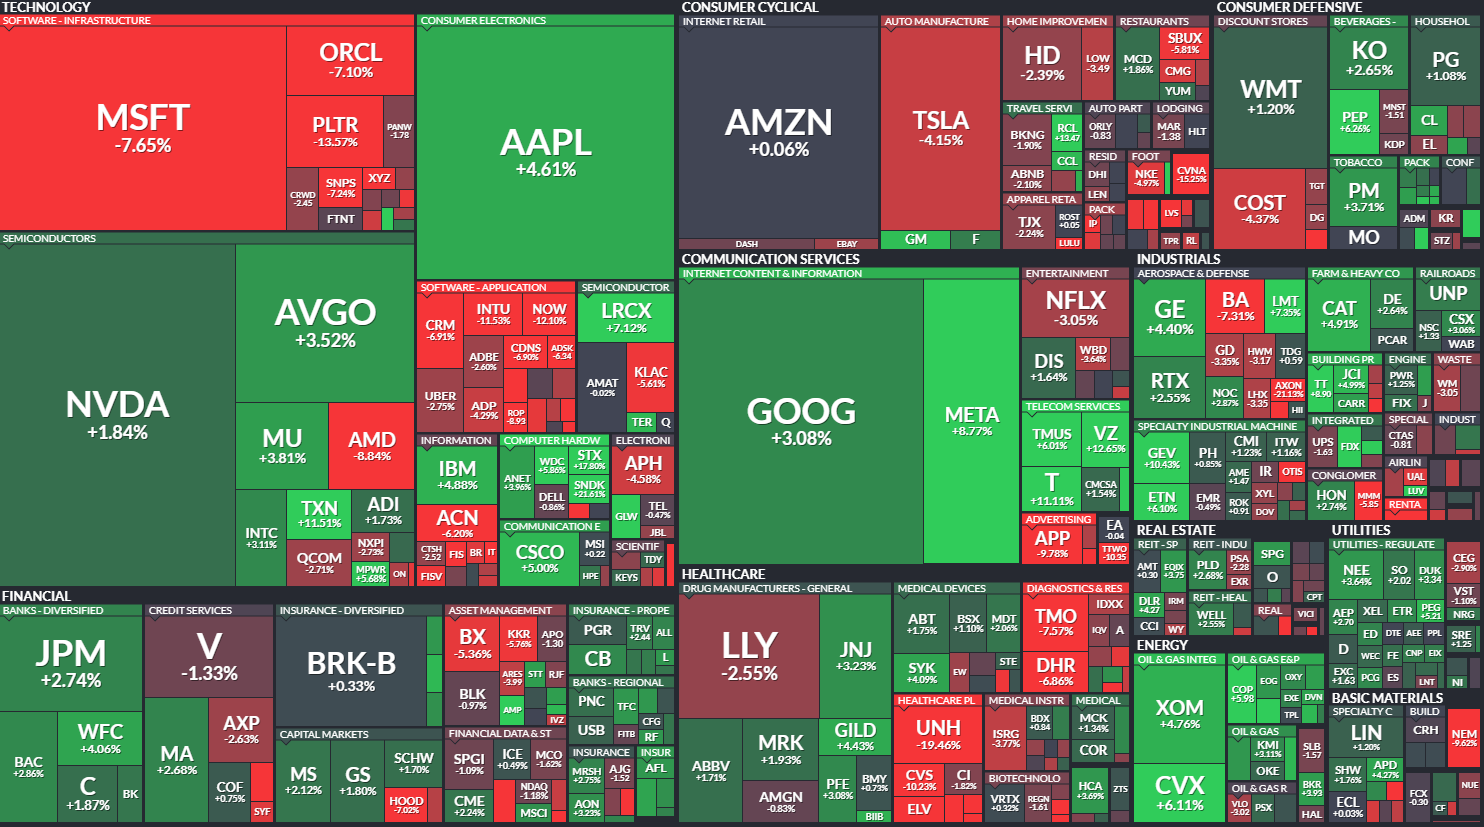
Top performers:
Verizon (+13%)
Royal Caribbean (+13%)
Texas Instruments (+12%)
AT& T (+11%)
Meta (+9%)
Biggest drops:
Axon Enterprise (-21%)
UnitedHealth (-19%)
Palantir (-14%)
ServiceNow (-12%)
Intuit (-12%)
Notable News
Earnings Season
Earnings season is no longer warming up - it’s running at full speed.
The fourth-quarter reporting cycle hit a major inflection point this week as several members of the “Magnificent 7” took center stage. Apple, Meta, Microsoft, and Tesla all delivered results that topped expectations. But beating estimates wasn’t enough to guarantee a rally. Market reactions were uneven, with Microsoft shares sliding sharply as investors fixated on heavy capital spending plans and signs of slower growth in its cloud business.
Zooming out, the bigger picture remains constructive. S&P 500 earnings are on track to grow roughly 10.1% year over year in the fourth quarter, a meaningful acceleration from earlier in the year. Technology continues to lead the charge, with profits expected to climb more than 25%, but strength isn’t confined to just one corner of the market. Eight of the index’s eleven sectors are forecast to report higher earnings, pointing to a healthier and more durable expansion.
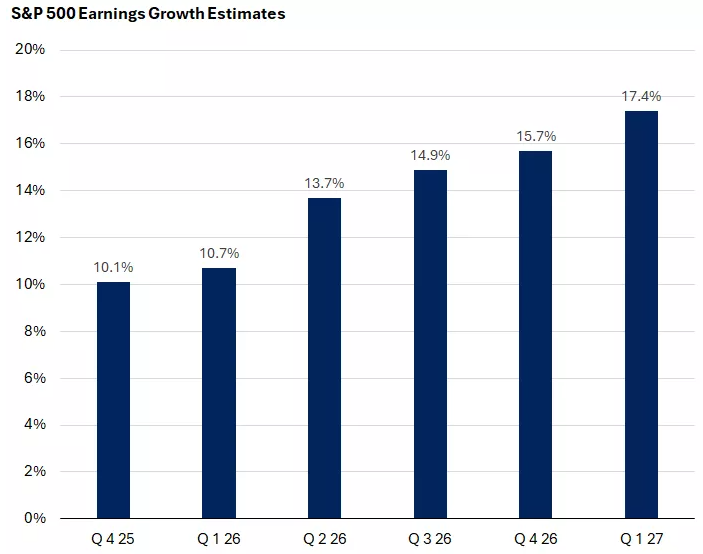
That breadth matters. Broad-based earnings growth tends to support a widening of market leadership - something investors have been waiting for after months of concentration in a handful of mega-cap names. And the outlook doesn’t stop with this quarter. Profit growth is expected to continue building momentum, with estimates calling for acceleration into 2027.
In short, while stock-by-stock reactions may remain choppy, the earnings engine driving this market looks increasingly hard to ignore.
Inflation
The Federal Reserve stepped to the sidelines this week.
After three straight rate cuts late last year, the Federal Open Market Committee held the federal funds rate steady at 3.5%–3.75% following its January meeting. The decision itself was widely expected, but the tone of the accompanying statement mattered just as much. Policymakers upgraded their view of the economy, noting that activity continues to expand at a solid pace, supported by resilient consumer spending and improving business investment.
The Fed also struck a more constructive note on the labor market. While job growth remains subdued, officials acknowledged signs of stabilization - an important shift after months of concern about cooling employment conditions. Inflation, however, remains the central challenge. The committee reiterated that price pressures are still elevated, even if they are no longer accelerating at the pace seen earlier in the cycle.
Taken together, the language suggests a central bank growing more comfortable with patience. After moving quickly to ease policy in recent months, the Fed now appears willing to wait, letting the data guide its next steps rather than rushing toward further cuts.
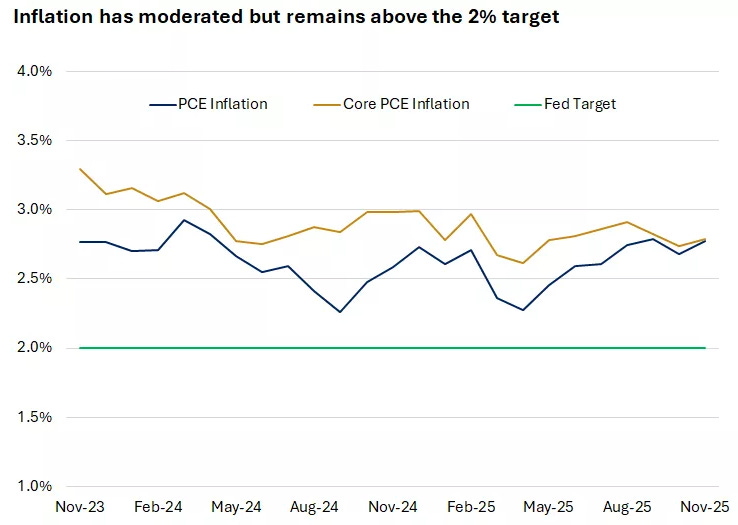
Inflation data helps explain that caution. The Fed’s preferred measure, the Personal Consumption Expenditures (PCE) price index, has continued to cool, helped by easing services inflation. That progress, however, has been partially offset by a renewed pickup in goods prices, driven in part by tariffs. The result is an inflation picture that is improving - but slowly. Price growth remains above the Fed’s 2% target, and the pace of disinflation has clearly decelerated.
For now, the message from policymakers is clear: policy is on hold, confidence in the economy is improving, and the bar for additional rate cuts has quietly moved higher.
Upcoming Rate Cuts
The leadership headlines out of Washington haven’t changed the bigger picture for monetary policy.
The difference now is speed. After moving quickly late last year, the Fed appears set to slow the pace of easing, opting for a more deliberate approach.
At current levels, policy is already hovering close to neutral. With the fed funds rate sitting at 3.5%–3.75% and PCE inflation running around 2.8% on an annualized basis, the math supports that view. A neutral policy rate in the U.S. is typically estimated at roughly 0.75% to 1% above inflation - placing today’s stance squarely in that zone.
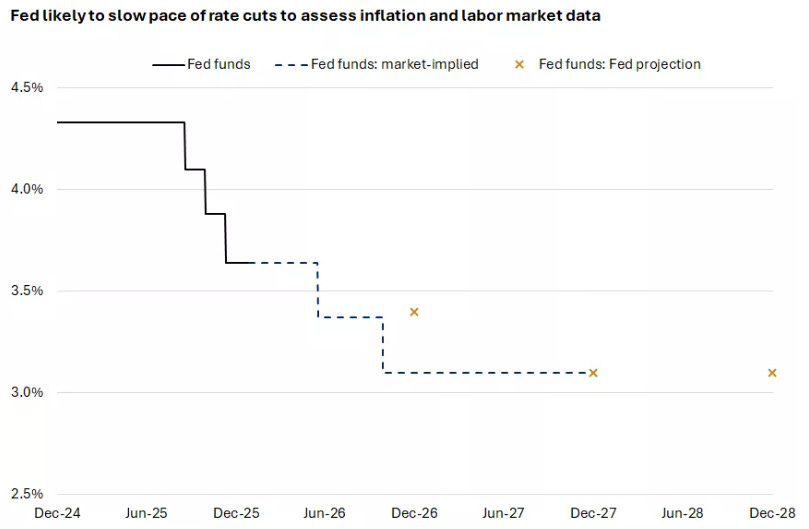
That positioning gives the Fed flexibility. If inflation continues to grind lower, policymakers should have room to resume cutting rates without meaningfully reaccelerating price pressures. The hurdle isn’t direction, but confidence. For now, the Fed looks less concerned about being too tight - and more focused on making sure it doesn’t move too fast.
Earnings Week

Join 120,000+ investors on YouTube! 🎥
We break down earnings, market moves, and exclusive insights you won’t find anywhere else.
Don’t miss out - hit the button below to watch and subscribe now! 👇
YouTube Channel 🔔
Subscribe today and stay ahead of the market!
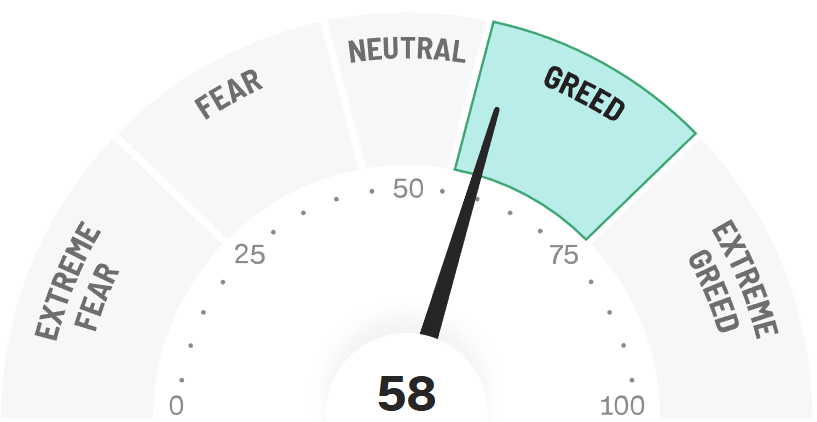
Fear & Greed Index
🔒 This section contains full valuation models, buy zones, and downside scenarios for all three stocks. Paid members unlock the complete research below.
3 Stocks to Buy After Earnings Crash
Earnings season often creates some of the best opportunities for long-term investors - not because the businesses suddenly became worse, but because short-term expectations collided with reality.
In many cases, post-earnings selloffs are driven more by guidance tweaks, sentiment shifts, or positioning than by true deterioration in long-term fundamentals.
Below are three stocks that sold off after earnings, where I believe the market reaction has created an attractive risk/reward setup for patient investors.
Two of these names are among the most widely held and closely watched stocks in the market.
They’re businesses most investors assume they can only buy on strength - not after sharp post-earnings pullbacks.
That’s what makes this setup so interesting: the market is briefly offering access to quality that rarely goes on sale.
1. Microsoft (MSFT)
Why Microsoft Crashed After Earnings

On the surface, Microsoft’s Q2 FY26 earnings looked strong. The company beat expectations on both revenue and earnings, reported 17% year-over-year revenue growth, and delivered another quarter of robust cloud performance.
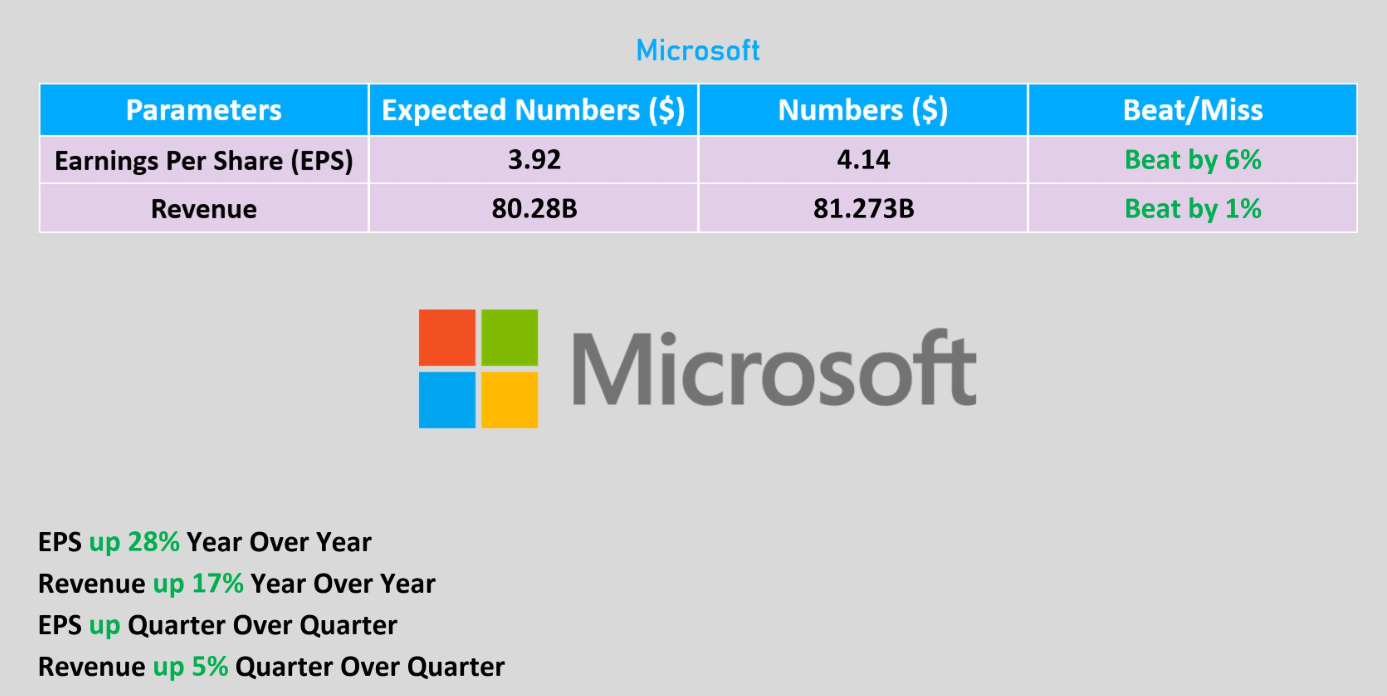
But the stock didn’t sell off because of weak results. It sold off because investors are increasingly focused on what Microsoft is spending to fuel AI growth - not just what it’s earning.
The headline concern was a massive surge in capital expenditures. Microsoft reported approximately $37.5 billion in quarterly capex, up roughly 66% year-over-year, driven by AI data centers, GPUs, and infrastructure build-out. That figure stunned the market and raised fresh questions about the near-term return on these investments.

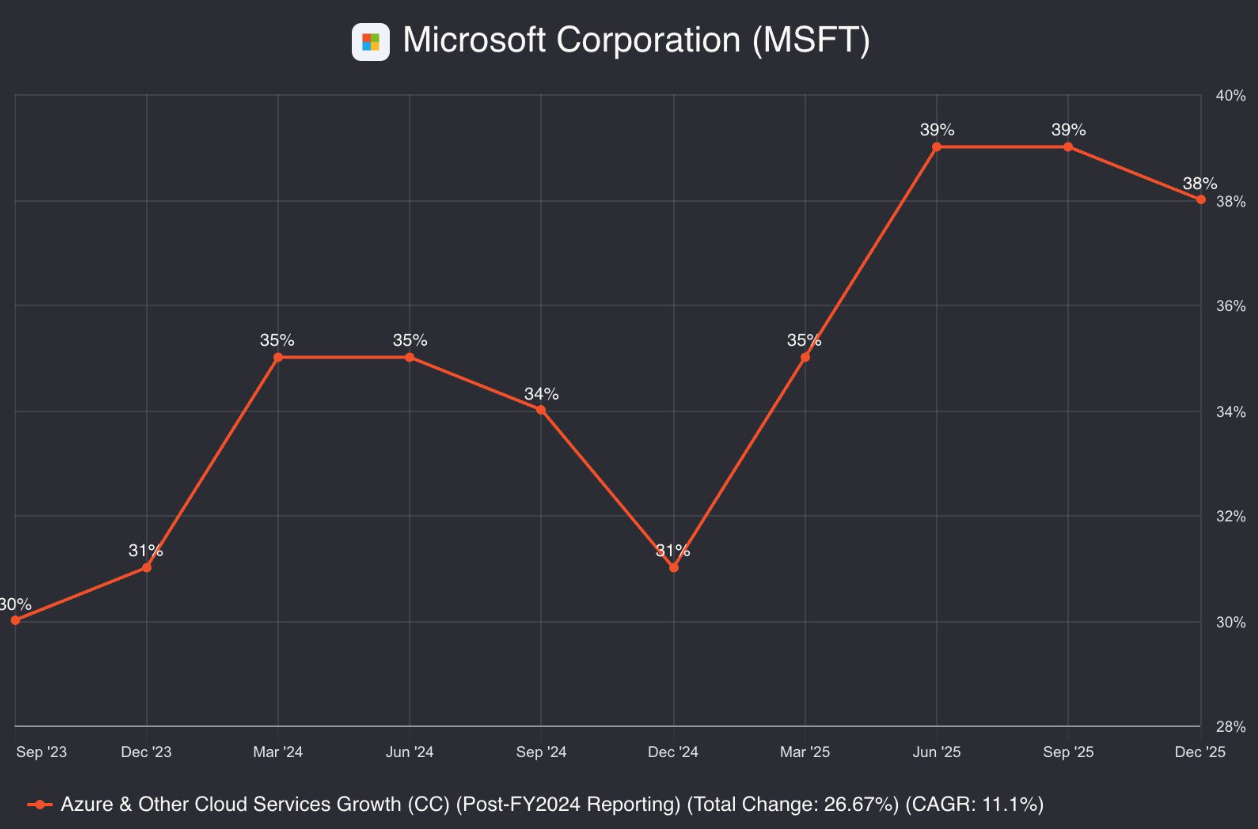
At the same time, Azure cloud growth - while still strong - came in at around 38% year-over-year, slightly below what the most bullish investors were hoping for and down modestly from prior quarters. In a stock priced for continued acceleration, even a small deceleration can trigger an outsized reaction.
Investors are also becoming more sensitive to free cash flow and margins. AI workloads are significantly more capital- and energy-intensive than traditional cloud services. Microsoft Cloud gross margins declined to around 67%, reflecting higher infrastructure and operating costs tied to AI expansion.
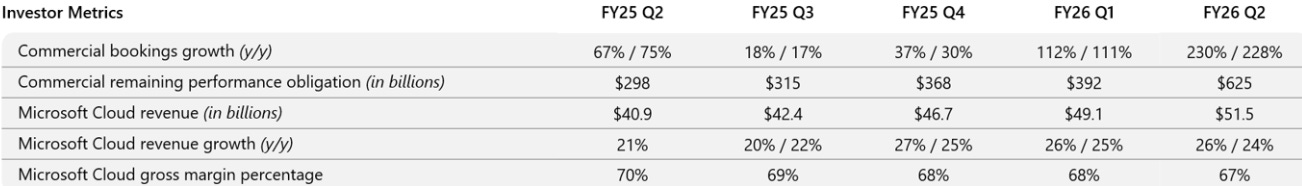
Another underappreciated factor: concentration risk. Roughly 45% of Microsoft’s $625 billion cloud backlog is tied to OpenAI, which has become a major driver of both demand and spending.

While that highlights enormous future opportunity, it also increases investor scrutiny around timing, monetization, and capital efficiency.
In short, this wasn’t a verdict on Microsoft’s business quality. It was a reassessment of the timeline and economics of AI returns. The market is asking a harder question: how quickly will today’s massive infrastructure spending translate into incremental profits - even for a best-in-class operator like Microsoft?
That shift in focus - from growth to return on growth - is what drove the sharp post-earnings selloff.
A Business of Exceptional Quality
It’s easy to get caught up in short-term earnings reactions. But zooming out, Microsoft’s long-term fundamentals tell a very different story - one of consistent execution, widening moats, and elite capital efficiency.
Over the past decade, Microsoft has quietly transformed into one of the highest-quality cash-generating businesses in the global market.
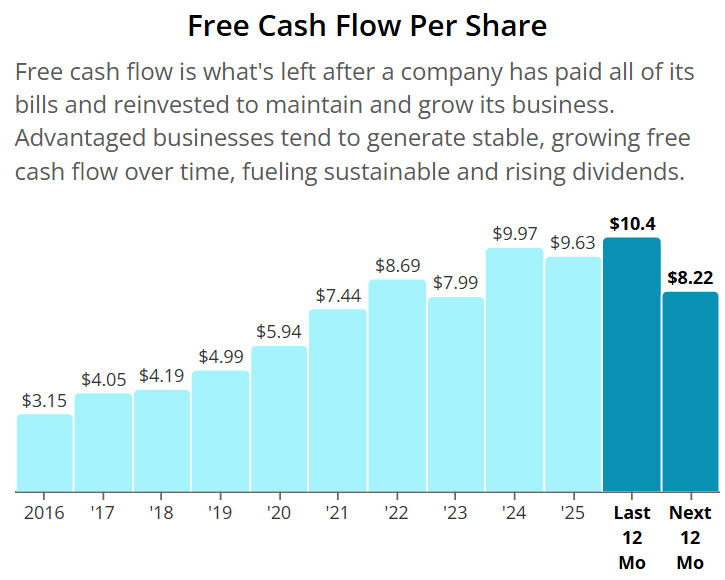
Free cash flow per share has grown from $3.15 in 2016 to $9.63 in 2025 - more than a 3x increase. That kind of growth reflects not just revenue expansion, but disciplined cost control, operating leverage, and durable pricing power.
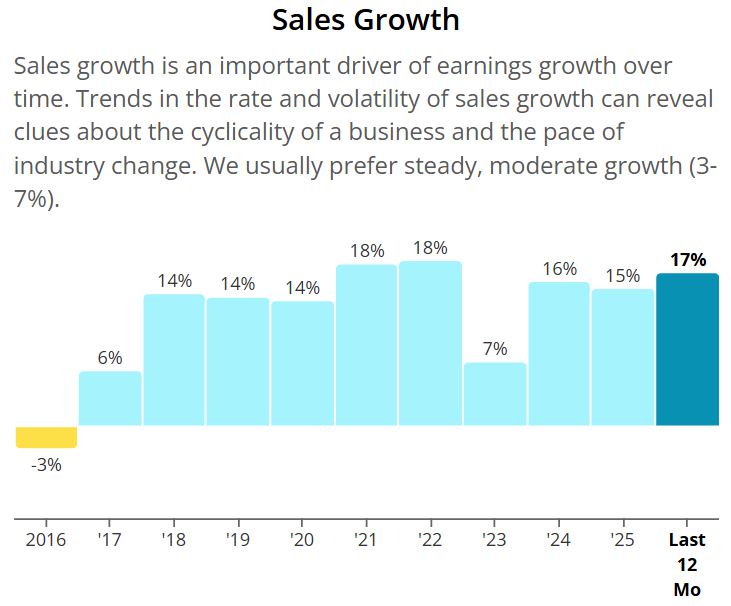
Revenue growth has also been remarkably consistent. In 7 of the last 10 years, Microsoft has delivered double-digit sales growth, an extraordinary feat for a company of this size and scale. Few mega-caps have compounded at this rate while also expanding profitability.
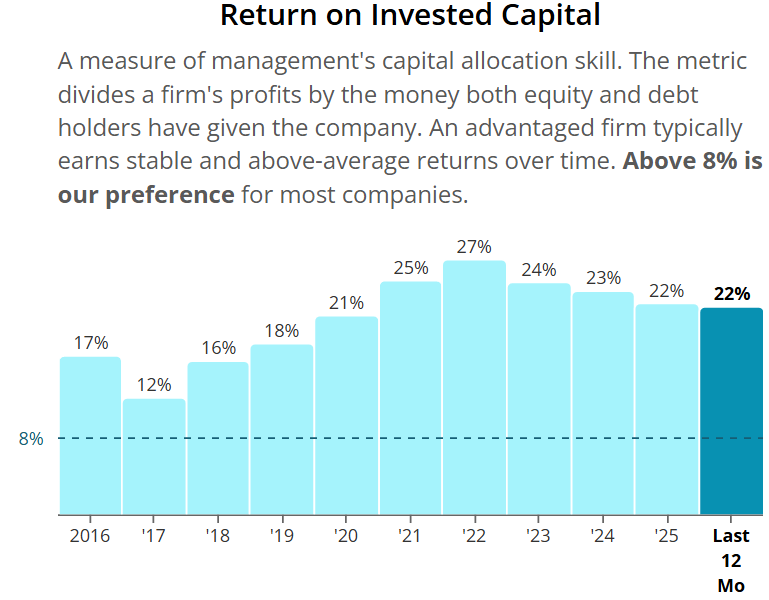
Returns on capital remain elite. Microsoft’s ROIC sits around 22% (TTM), placing it firmly among the highest-quality large-cap businesses in the market. This signals that incremental investment is still generating strong economic value - even as the company operates at massive scale.
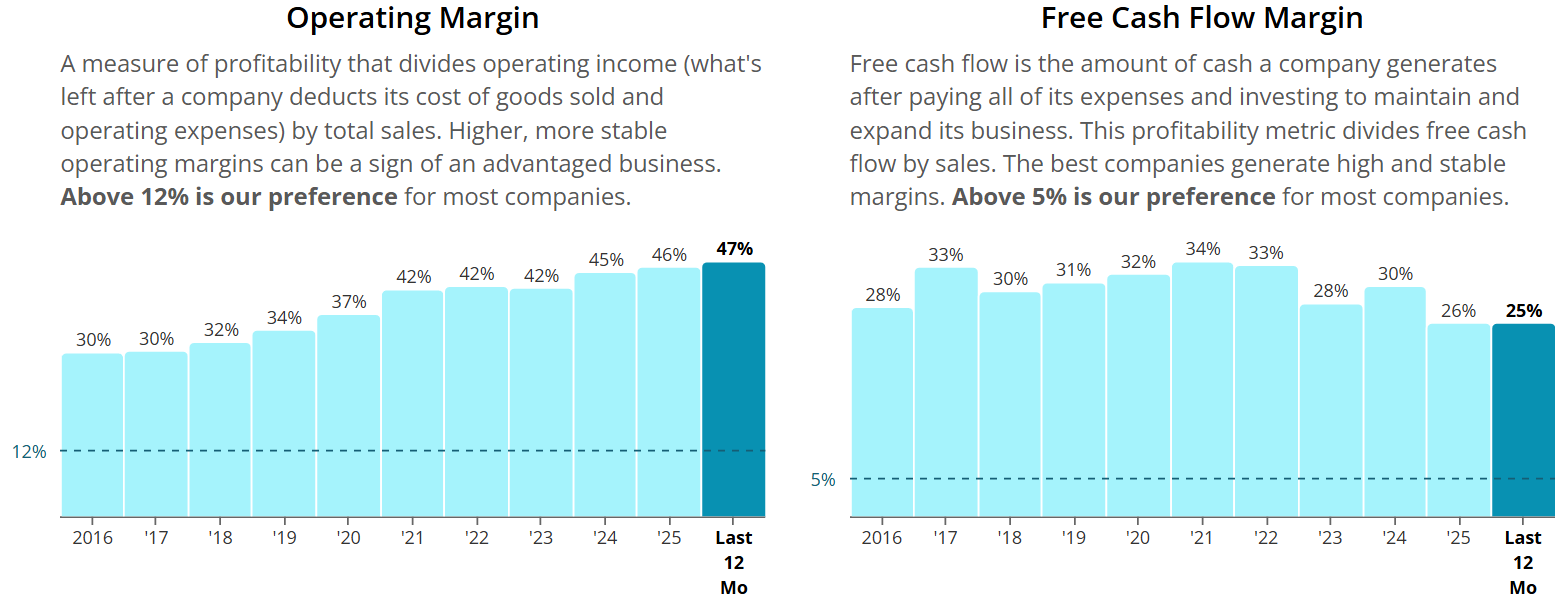
Profitability has structurally improved as well. Over the same period:
Operating margins have expanded from ~30% to ~47%
Free cash flow margins now sit around 25% (TTM)
This margin expansion reflects the shift toward higher-margin cloud, software, and subscription-based revenue - and highlights Microsoft’s growing operating leverage.
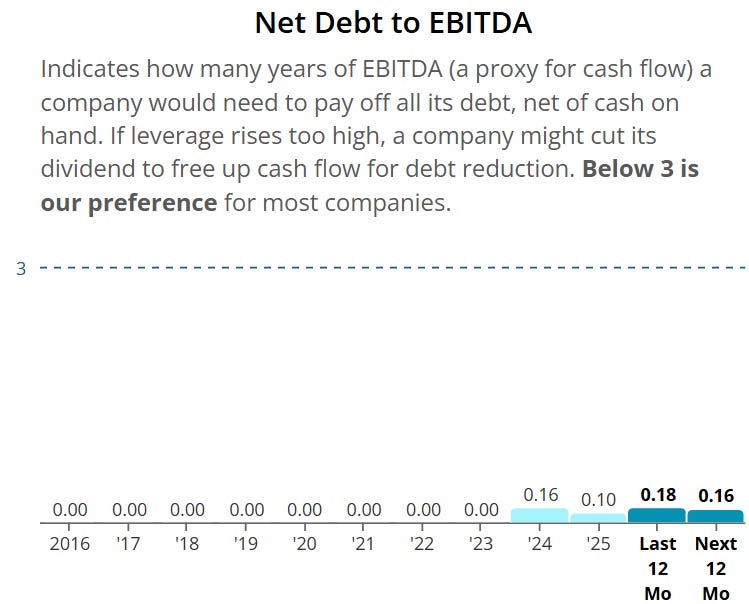
Balance sheet strength adds another layer of resilience. Net debt to EBITDA of just 0.18x gives Microsoft enormous financial flexibility, allowing it to invest aggressively in growth while maintaining one of the strongest balance sheets in large-cap tech.
Finally, cloud has been a powerful long-term growth engine. Microsoft’s cloud revenue has grown at a 27% CAGR from 2019 to 2025, transforming the business mix and anchoring long-duration growth in recurring, mission-critical workloads.

Taken together, these metrics paint a clear picture: this is not a fragile, hype-driven growth story. Microsoft is a structurally stronger, more profitable, and more cash-generative business than it was a decade ago - even before layering in the full potential of AI.
🔒 Paid Members: Microsoft’s full valuation model, buy zones, downside risk, and my verdict (Buy / Hold / Avoid) are unlocked below - along with deep dives on Stock 2 and 3.
Free readers get the story.
Paid readers get the numbers and the decision.