

One stock in this week’s list is almost 48% below its 52-week high. Another offers a 4.5% dividend yield, more than three times its five-year average. The largest cash-flow valuation gap exceeds 40%.
Those numbers caught my attention. I want to know whether the income can last and whether the purchase price leaves room for a forecast to be wrong.
I ranked four familiar dividend payers on business quality, income, valuation and the assumptions required to make the numbers work.
First, I’ll explain what this sell-off means for dividend investors and then give you a checklist you can apply to your own holdings.
The damage depends on what you own
The initial post-election rally quickly gave way to a sharp reassessment of the AI trade. Potential changes to data-centre permitting and the economics of heavy capital spending are among the concerns behind that shift.
Those are plausible explanations for investors demanding lower prices, rather than proof that every affected business has suffered a permanent loss of value.
The diversification chart below makes the uneven damage clear. The semiconductor ETF is 33% below its own all-time high, while the S&P 500 ETF is 6% below its peak. The Nasdaq 100 ETF sat between them at a 15% decline.
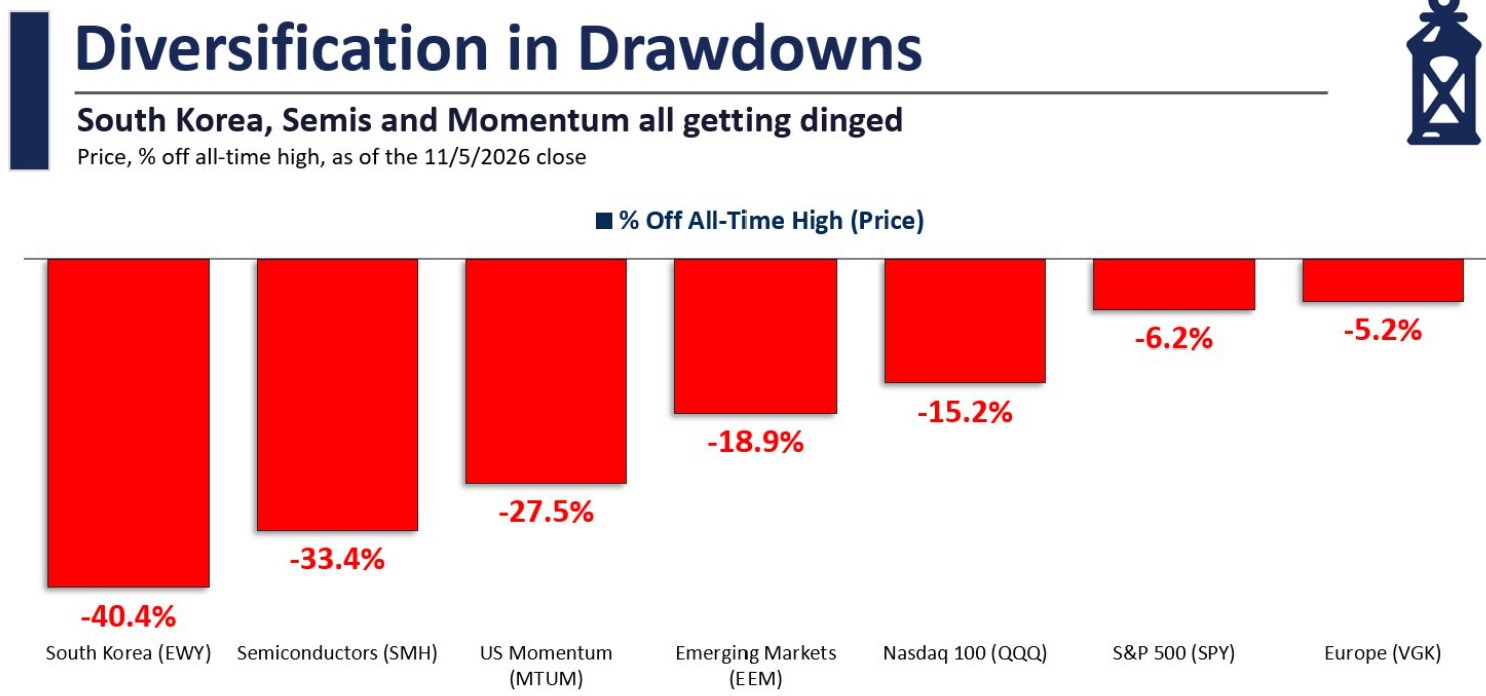
That difference matters when you assess your portfolio. Several holdings can look diversified by company name while still depending on the same customers, capital-spending cycle or source of financing.
Dividend payments do not remove that concentration. I want to understand what generates the cash behind each payment and what could interrupt it.
Fear needs a denominator
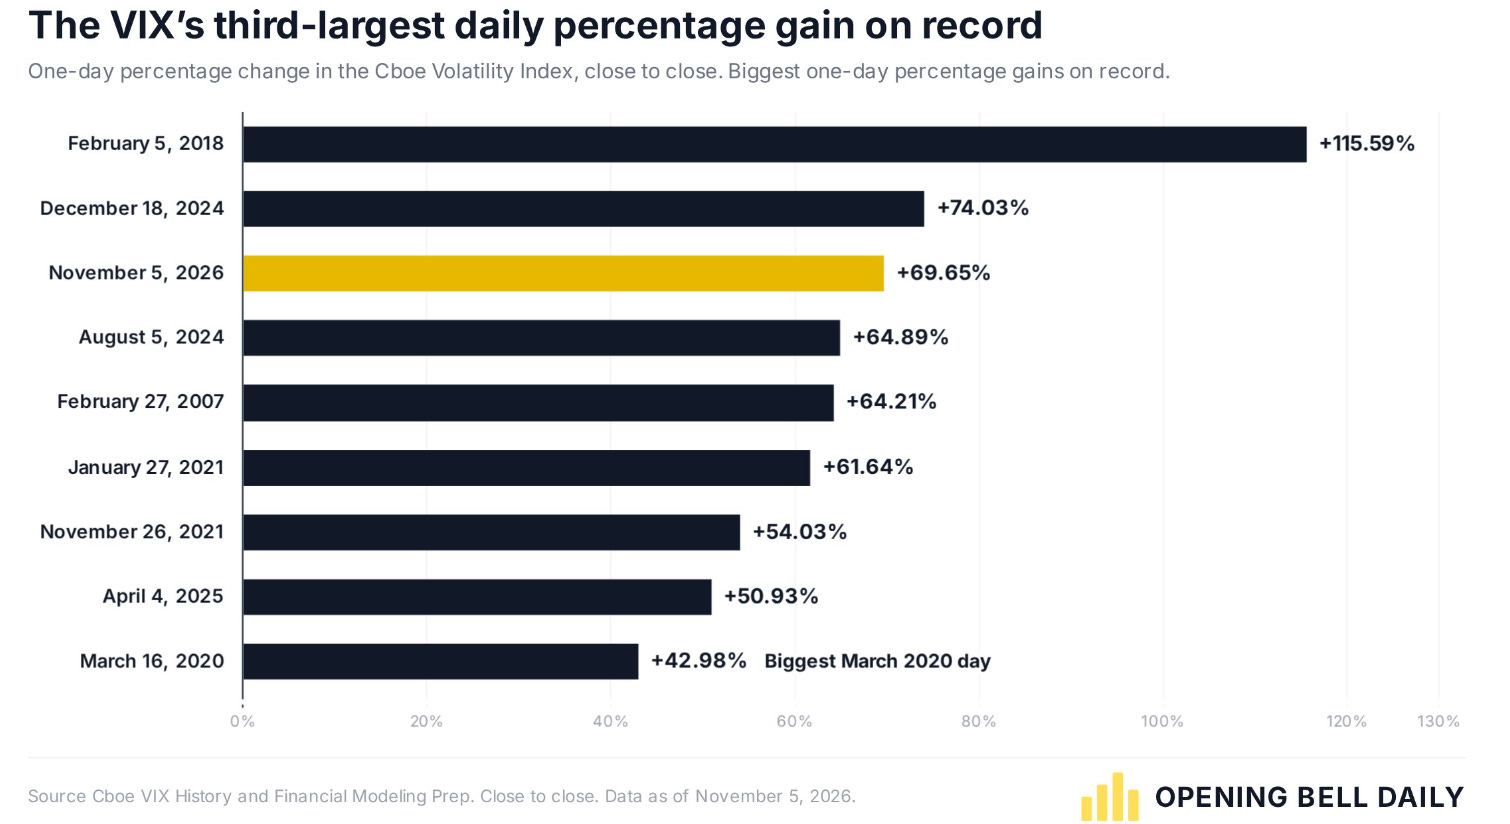
One of the week’s most dramatic charts showed the VIX rising by almost 70% on 5 November.
The chart below adds important context: it closed at 28.18, compared with a March 2020 closing peak of 82.69.
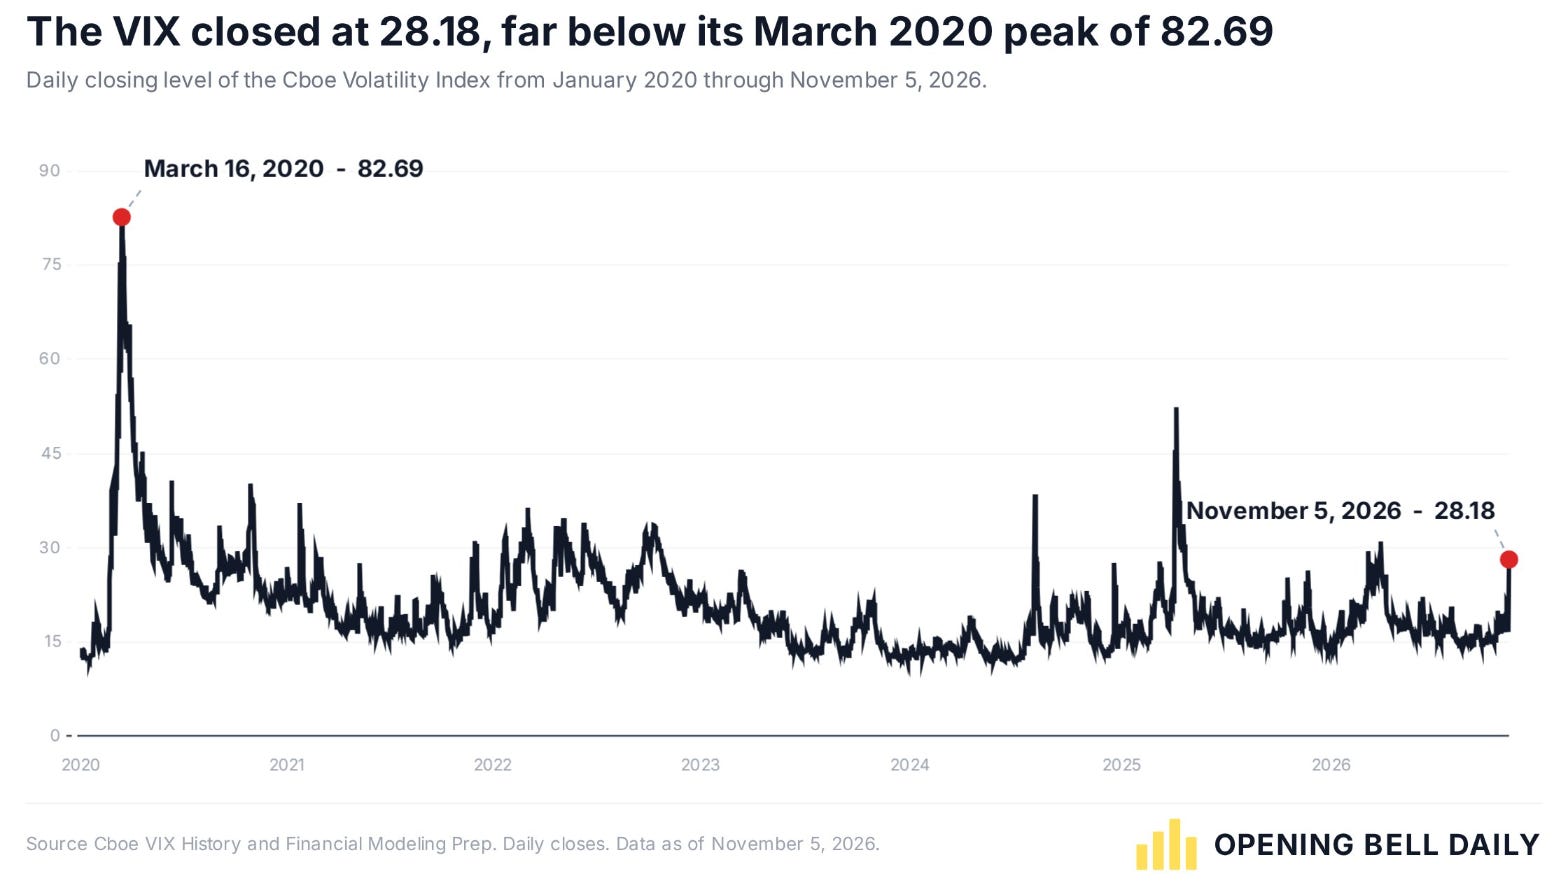
A large percentage increase from a relatively low starting point can look extraordinary. The absolute level answers a different question. Neither reading tells us that the market has bottomed, and neither tells us what a particular company is worth.
For a long-term income investor, the useful response is to revisit the cash-flow assumptions behind a holding.
Has the price changed more than the business, or has the business changed enough to justify the price?
Safety can carry an expensive price
The sector valuation comparison offers another useful challenge.
In this snapshot, consumer staples and healthcare trade above their own five- and ten-year average P/E ratios, while several other sectors trade below theirs.
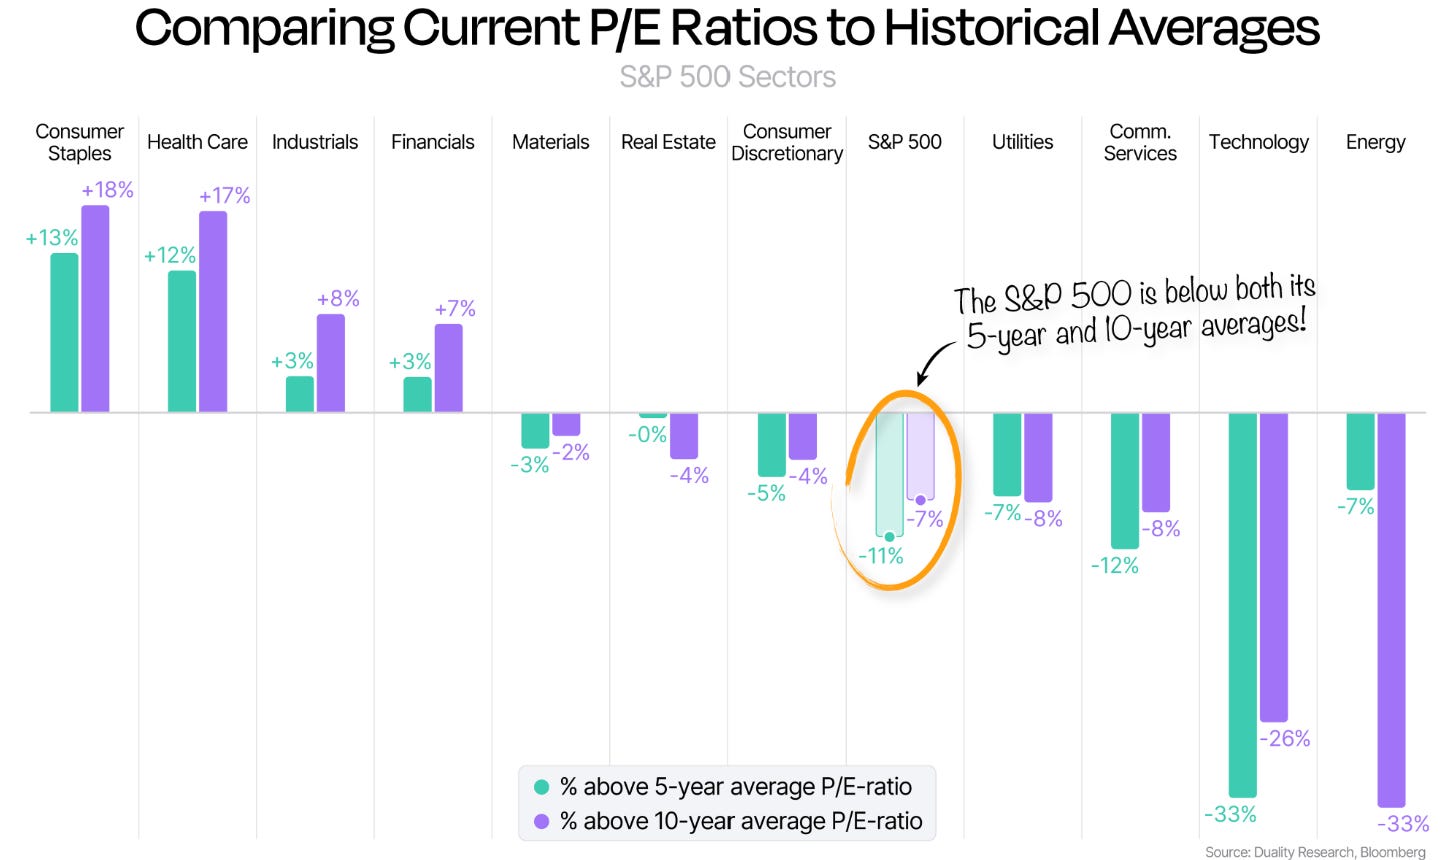
A stable business can deserve a premium. The question is whether that premium still leaves an acceptable return for the buyer. Equally, a former growth stock can deserve a lower multiple if its prospects have weakened.
Here is a simple illustration.
A share at $100 with $5 of annual earnings trades at 20 times earnings. If its price falls to $75 but earnings fall to $3.50, the multiple rises to 21.4 times.
If its $4 dividend remains unchanged, the yield rises from 4% to 5.3% at the same time.
The bigger yield attracts attention. The weaker earnings require investigation.
My three tests before buying a dividend dip
First, check the cash available to support the payout. I look for coverage after the investment needed to keep the business competitive. An earnings payout ratio helps, but cash conversion, working capital and capital expenditure can change the picture. For a lender, capital requirements and credit losses need their own treatment.
Second, check the balance sheet through a weaker period. A company needs room to service its obligations and invest while protecting the dividend. A single low leverage ratio does not answer every question, especially for financial businesses.
Third, test the purchase price with less favourable assumptions. A valuation based on recovering cash flow should also show what happens if that recovery arrives later or grows more slowly. My entry price should leave room for that uncertainty.
The practical lesson is to separate the business decision from the entry decision. A company can remain a reasonable holding while offering insufficient value for a fresh purchase today.
Four candidates with very different investment cases
Here is the anonymous comparison before the company research. The P/E figures use the historical-comparison charts in my research snapshot, keeping each current figure alongside its own historical average.

The biggest price decline belongs to a company still trading above its historical forward multiple.
The deepest historical P/E discount belongs to a company whose near-term earnings estimates have weakened.
The largest headline cash-flow upside requires a different valuation approach because of how its business is financed.
That is where the individual research becomes useful.
Below, paid members get all four names, the assumptions behind the valuations, downside scenarios, exact buy-below prices and my ranked buying plan. The aim is to make the next decision clearer, including when waiting is the better use of fresh cash.