


Every month on the 15th, I take a fresh look at the stocks Wall Street believes offer the most upside.
On the surface, the process sounds straightforward:
Find the biggest gaps between current share prices and analyst targets, sort them from highest to lowest and buy the names at the top.
That is also one of the easiest ways to be misled by a stock screener.
The most “undervalued” company in this month’s raw data appeared to offer:
849.8% upside
It did not.
The likely explanation was a simple but dangerous unit mismatch.
A Vodafone analyst target quoted in pence appeared to have been compared with the price of its US-listed ADR in dollars.
One broken comparison was enough to transform an ordinary analyst target into what looked like a potential ten-bagger.
That single example captures the entire purpose of today’s report.
A free screener can show us where analysts are optimistic.
It cannot reliably tell us:
Whether the target is current;
whether the company has completed a stock split;
whether a spin-off has changed the underlying business;
whether currencies and share classes are being compared correctly;
whether a low P/E reflects sustainable earnings or the top of a cycle;
or whether the business is strong enough to deserve our money.
So this month, I went much further.
I reviewed 328 stocks carrying either a Strong Buy or Moderate Buy analyst consensus.
I then applied a stricter quantitative filter, reduced the universe to 70 qualifying names, ranked the most interesting candidates, investigated the biggest data-quality risks and manually selected the:
Five stocks worth researching first
This is not a list of five stocks I am blindly buying today.
It is something more useful:
A structured research queue showing where Wall Street’s optimism appears credible, where patience is required and where the headline upside should not be trusted at all.
The market is rising but conviction is not
The S&P 500 is up approximately 10.2% year to date, having recovered strongly from the correction earlier in the year.
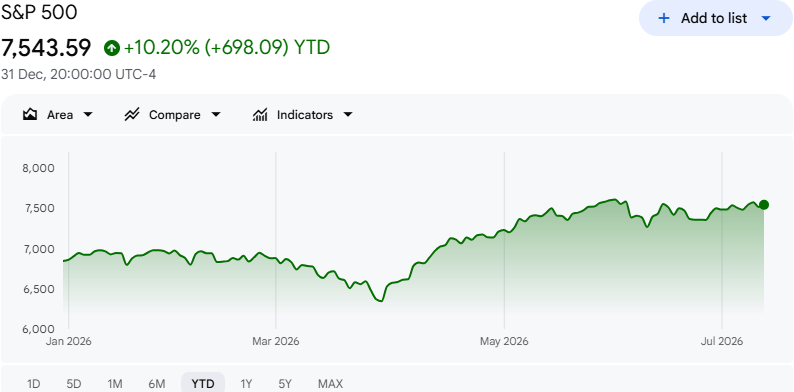
The S&P 500 is up roughly 10.2% year to date after recovering from its spring correction.
At first glance, that looks like a straightforward risk-on market.
Underneath the index, however, the picture is considerably less comfortable.
The Fear & Greed Index remains in Fear territory at 44.
Retail net inflows have fallen sharply.
Single-stock volatility premiums are near cyclical highs.
And July’s performance has been extremely uneven.
Some of the market’s largest AI beneficiaries have continued to rise, while parts of semiconductors, software, industrials and healthcare have been hit hard.
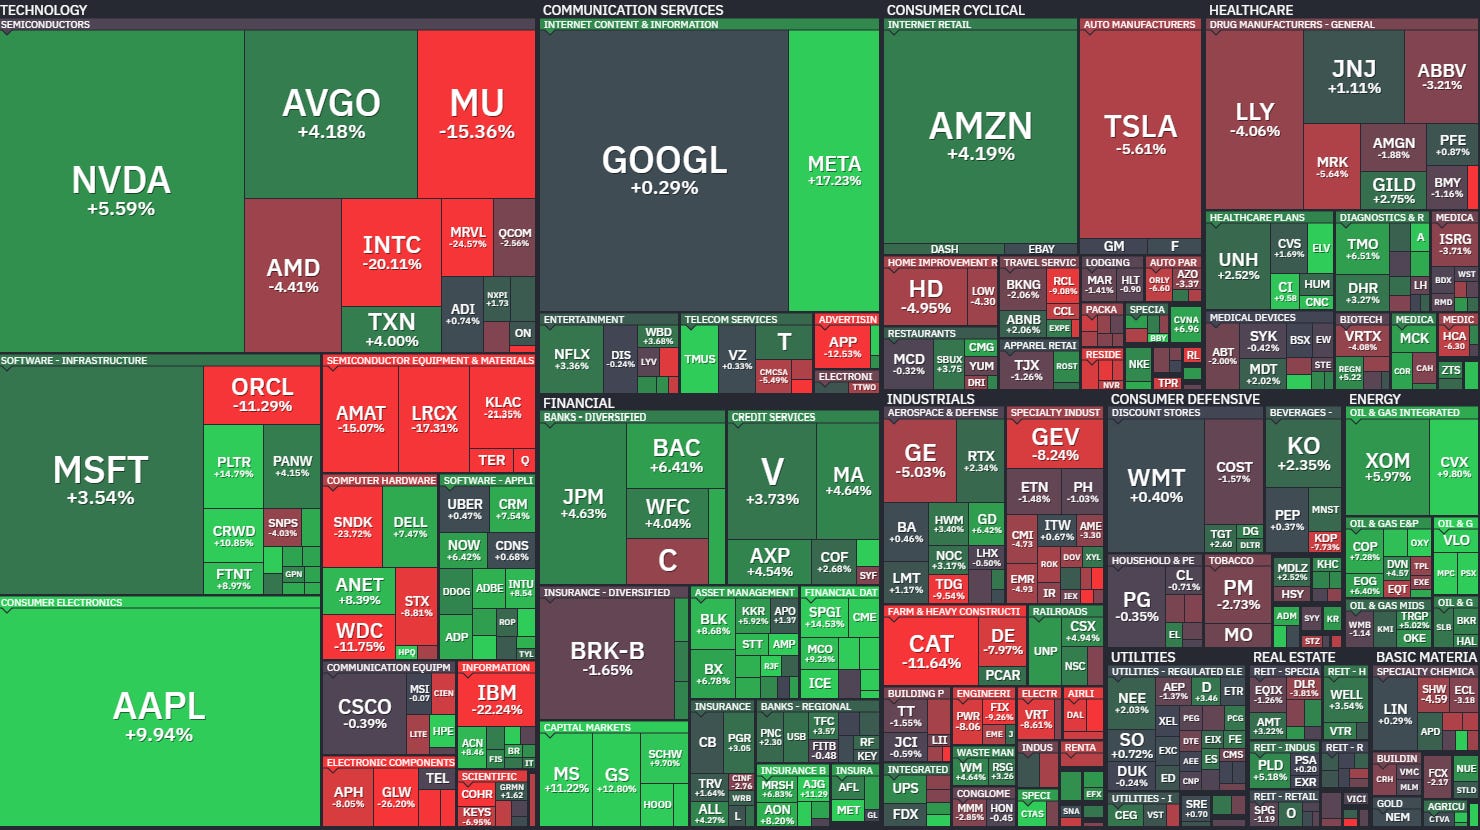
July’s heatmap so far. The index-level move hides enormous dispersion beneath the surface.
That dispersion matters.
When almost everything rises together, stock selection can look easier than it really is.
When leadership narrows and volatility increases, the difference between a durable business and a fragile narrative becomes much more visible.
This is exactly the environment in which analyst targets can be useful but only as a starting point.
Earnings are doing the heavy lifting
The underlying earnings picture remains strong.
Current estimates point to approximately:
12% year-over-year S&P 500 revenue growth
23% year-over-year S&P 500 earnings growth
Technology is expected to lead revenue growth, while Energy and Technology are forecast to deliver the strongest earnings growth.
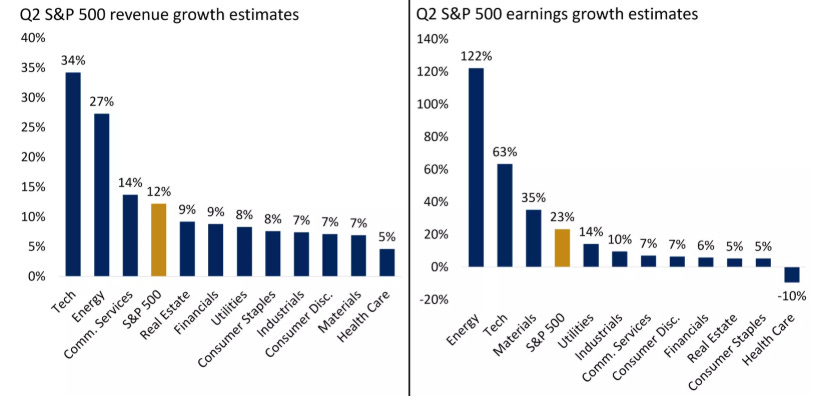
Technology and Energy are expected to lead Q2 growth, but the bar for positive surprises is already high.
There is also an important reason not to dismiss Wall Street estimates completely.
Wall Street has underestimated final S&P 500 earnings growth for 13 consecutive quarters.
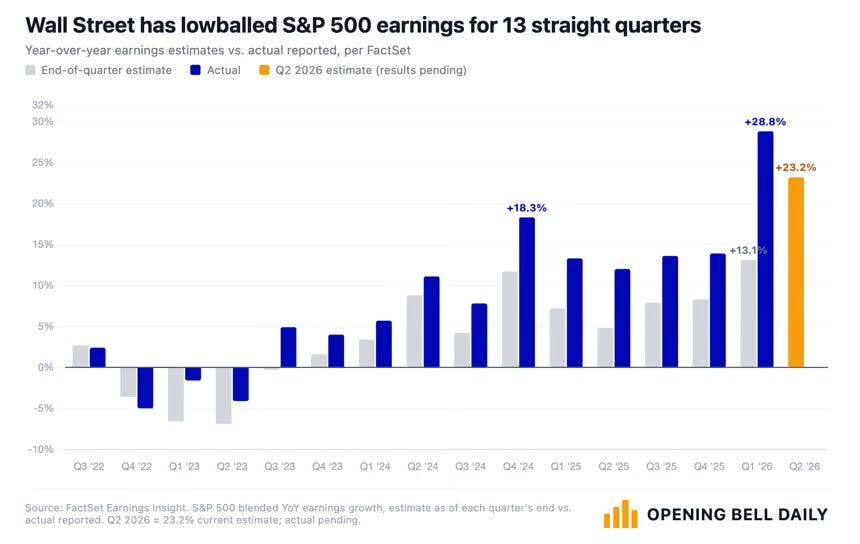
Wall Street has repeatedly started too cautiously but that does not mean every individual stock target is reliable.
The key distinction is between earnings estimates and price targets.
Earnings estimates can be revised each quarter as companies report new information.
A price target adds several more layers of judgement:
What valuation multiple should investors pay?
How quickly will margins expand?
How durable is the company’s growth?
How much risk should be discounted?
What will interest rates and investor sentiment look like?
Will the market still reward the same sector in 12 months?
That is why a company can beat earnings while its stock falls.
It is also why a price target can remain far above a share price for years without ever being reached.
AI is still leading but the easy phase may be over
AI beneficiaries produced a stellar second quarter, but volatility has increased sharply at the start of Q3.
The Philadelphia Semiconductor Index and Korea’s KOSPI surged during the first half of the year before experiencing much larger swings.
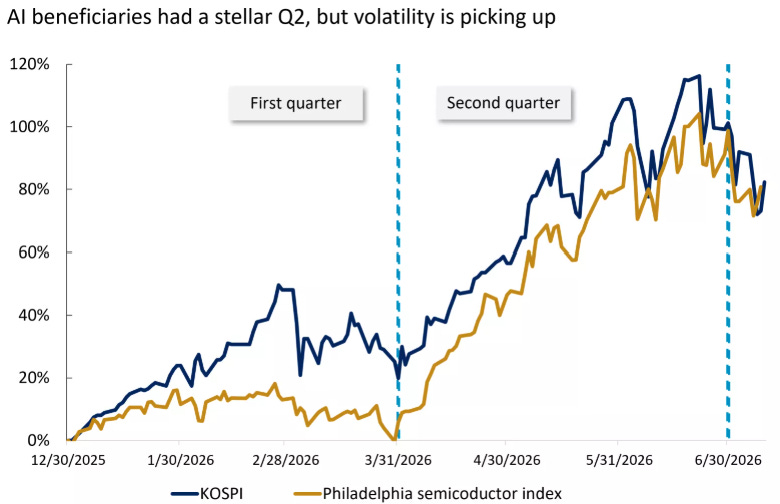
AI beneficiaries delivered extraordinary first-half returns, but volatility has started to rise.
That does not necessarily mean the AI investment cycle is ending.
It does mean the market is becoming less willing to reward every company simply for spending more money on AI.
The next phase is likely to be more selective.
Investors will increasingly want evidence that:
AI spending is producing revenue and cash flow;
demand remains strong after the initial infrastructure buildout;
margins can absorb continued capital expenditure;
end customers are receiving measurable value;
and valuations still leave room for upside if growth remains merely good rather than extraordinary.
This matters for today’s screen.
Technology produced the largest number of qualifying names, while Industrials and Energy were close behind.
The opportunity set is broad but it is not neutral.
It contains major underlying bets on:
AI infrastructure;
software monetisation;
industrial restructuring;
power demand;
and the commodity cycle.
The index looks calm, but the opportunity set underneath it is changing quickly. Share this report with an investor who would find the full screening process useful.
What I found after screening 328 Buy-rated stocks
Here is the headline data:
328 stocks screened
166 Strong Buy ratings
162 Moderate Buy ratings
21.8% median analyst upside
70 stocks passed the premium quantitative filter
27.4% median upside among the 70 passes
Only five passed my final editorial review
The raw list was undeniably attractive.
Across the full universe, the median company was expected to rise almost 22%.
After removing Vodafone’s obvious data anomaly, average target upside was approximately 24.6%.
The stricter group looked even stronger.
The 70 premium-filter passes had:
Median upside of 27.4%
Average upside of roughly 31%
But the more impressive those numbers became, the more important it was to challenge them.
High upside can be created by several very different situations.
It may represent:
A genuinely undervalued, high-quality business;
a stock that has collapsed because earnings expectations are falling;
a cyclical company being valued on peak profits;
an analyst target that has not been updated;
a corporate action that has broken the historical comparison;
a company carrying risks that are difficult to capture in a spreadsheet.
My job was not to find the biggest percentage.
It was to identify which percentages deserved further work.
What paid members receive today
Paid members receive:
My complete five-stock ranking;
the full investment case for every finalist;
current price, target, upside, valuation and dividend data;
the evidence that allowed each stock to pass;
the specific risk that could break each thesis;
what I would investigate before buying;
my full Top 30 quantitative research queue;
additional quality, dividend and cyclical watchlists;
the stocks whose headline upside should not be trusted;
a 30-day earnings and research plan;
and the companion Excel workbook containing the complete 328-stock universe, scoring methodology and editable research tracker.
The five finalists include:
A European software leader with nearly 50% analyst upside;
a dominant software compounder trading at a compressed valuation;
the strongest growth company in the entire screen;
an industrial special situation where the headline target requires careful repair;
and a media turnaround finally showing evidence of sustainable streaming economics.
Paid members receive the complete High-Upside Stock Report every month on the 15th, alongside the full screening database and research tracker.
Paid members will also receive the downloadable 328-stock workbook at the end of today’s report.