April Undervalued Stocks
+ Spreadsheet Inside!
Each month, paid subscribers get access to a spreadsheet highlighting stocks that appear undervalued based on multiple metrics.
This month, 35 stocks made the cut by meeting all four of our criteria below.
Undervalued Stocks Criteria
The stocks were selected based on the four criteria below:
Dividend Yield Theory
This method suggests a stock may be undervalued when its current dividend yield is higher than its 5-year average.
For example, the company below appears undervalued, as its current yield of 6.79% exceeds the 5-year average of 4.17%.
Another sign of undervaluation is the Forward P/E ratio of 8.6x, which sits below the 5-year average of 11.3x.
Dividend Safety (Minimum Safe Level: 60+)
To ensure long-term dividend stability, we focus on companies with safe and sustainable dividends.
A strong dividend safety score increases confidence that payouts will continue well into the future.
Upside Potential: 20%+
While dividends are great, we also want growth.
That’s why we focus on companies with at least 20% upside potential, ensuring both income and capital appreciation.
Strong Balance Sheets
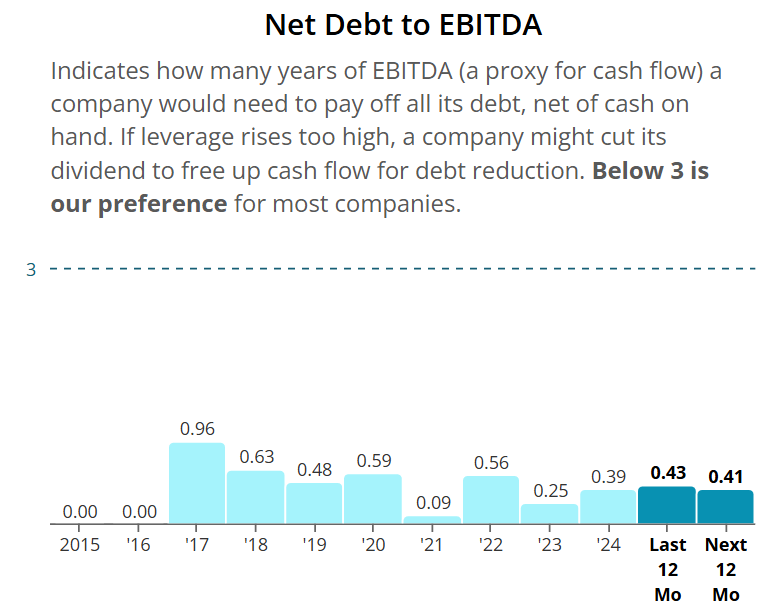
We prioritize companies with solid financial health, measured in part by a reasonable Net Debt to EBITDA ratio, ensuring they can manage debt effectively while continuing to grow.
For most companies, this means a Net Debt to EBITDA ratio below 3, while for REITs, a threshold below 5.5 is preferred.
April Spreadsheet
Keep reading with a 7-day free trial
Subscribe to Dividend Talks to keep reading this post and get 7 days of free access to the full post archives.


