Avoid Dividend Cuts!
Watch Out For These Signs.
Introduction
One thing every dividend investor can agree on is that they hate it when Companies cut their dividend. Seeing your PADI (projected annual dividend income) shrink is not what you want.
In today’s newsletter we are going to run through some key metrics to look out for when identifying dividend cuts, BEFORE they even happen!
Recent Dividend Cuts
January 30th and March 7th - New York Community (NYCB) cut their dividend twice, 71% and then by 80%
January 4th - Walgreens (WBA) cut their dividend by 48%
15th March - Vodafone (VOD) cut their dividend by 50%
April 30th - Leggett & Platt (LEG) cut their dividend by 89.1%
April 30th - 3M (MMM) cut their dividend (exact % to be confirmed this month)
The Ideal Company
We want to invest in Companies which are high quality compounders where the dividend is completely safe.
We want them to be as close to a 99 Very Safe score that we see above. So, what do we need to look out for?
The Signs Are Right In Front Of You
1 - Free Cash Flow Payout Ratio
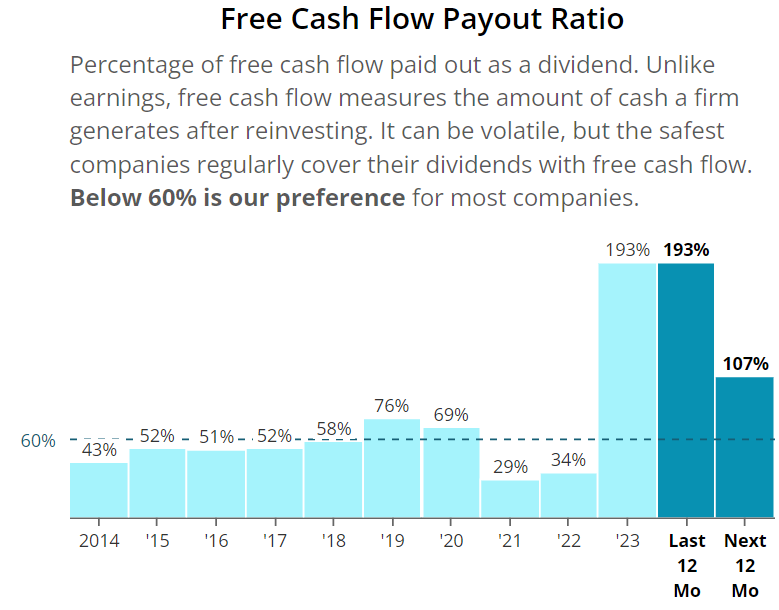
This metric shows us the percentage that management pay out in dividends in relation to their free cash flow.
The first thing to mention here is that we ALWAYS focus on the free cash flow payout ratio as opposed to the earnings payout as it is susceptible to manipulation by management through their accounting and can stop you from identifying this pattern.
My blanket rule here is below 60% as this gives me faith that management can offer those double-digit dividend increases we love to see as dividend growth investors.
What we see above is a MASSIVE red flag indicator as in both 2023 and expected 2024, management will be paying out MORE in dividends than the Company will generate in free cash flow.
If you see this pattern consistently then it can indicate that a dividend cut could be coming.
2 - Net Debt To EBITDA
This metric shows us the number of years it would take the Company to pay off all of its debt, net of cash on hand.
It also correlates to not only the dividend safety but also the balance sheet strength.
Now for different industries the preference will be different but for our example above we see that it should be below 3.5.
So when we see that this metric is consistently (and significantly) above the ideal rate it shows us that this Company has a weak balance sheet and that the dividend is not safe.
We might be able to look at trends and see that it is coming down over time (which is a good sign), but we can go a step further and combine this with the free cash flow payout.
For example, if we notice that both the Net Debt to EBITDA levels are very high as well as a high free cash flow payout we can with some degree of confidence estimate that a dividend cut is coming.
Now these are the KEY 2 to look out for, but we can also get some hints when looking at other metrics like those in the section below.
Other Signs
1 - Sales Growth
When a Company is finding it difficult to increase their top line revenue over a long period of time this can show weakness and let investors know that it is struggling. If a Company cannot even keep up in line with inflation (4%) then in real terms it is decreasing which will ultimately lead to the dividend not growing (and possibly cut!).
2 - Low Margins
If you are investing in a Company you want to see that it has at a minimum those margins in line with the industry (and ideally higher to show that it is a market leader and that consumers are willing to pay more for this brand).
When margins are low it could indicate that the Company is struggling and this could in time lead to no dividend increases or possibly very trivial increases below inflation.
3 - Free Cash Flow Per Share
As investors we want to invest in Companies that can continuously increase their free cash flow year on year. If we do not see this trend we should keep it on our radar, and ensure that it is a one off as without the increases it will be very difficult for Companies to offer rising dividends.
Conclusion
In conclusion you want to ensure that before you are investing in Companies you perform your own due diligence and take note of the following:
The Free Cash Flow Payout
Net Debt to EBITDA levels
Sales Growth
Margins
Free Cash Flow
As always, we want Companies to increase their dividend and avoid those who cut them.
If you’d like to support this work feel free to buy me a coffee. The proceeds will contribute to the running costs of the newsletter.
Join the community of investors - subscribe now to receive the latest content straight to your inbox each week and never miss out on valuable investment insights.
If you found today’s newsletter helpful please consider sharing it with your friends and colleagues on social media or via email. Your support helps to continue to provide this newsletter for FREE!
Note: I am not a financial advisor or licensed professional. Nothing I say or produce anywhere, should be considered as advice. All content is for educational purposes only. I am not responsible for any financial losses or gains. Invest and trade at your own risk.


