


Some of the market’s biggest stocks are being marked down sharply. Investors now have to decide how much of that decline reflects a weaker business and how much reflects a better purchase price.
That decision becomes harder when the market sends conflicting signals.
Parts of technology are deep in the red. Other sectors are climbing. The S&P 500’s headline return looks much stronger than the experience of many individual stocks.
Meanwhile, corporate earnings expectations remain high.
This week, I brought together 40 companies worth more than $10 billion that were trading within 15% of their 52-week lows. The list includes businesses across healthcare, software, consumer spending, industrials, property and financial services.
Below, I’ll explain the market backdrop, share the full candidate list and set out the tests I use to assess it. The detailed ranking, valuations and preferred entry prices follow in the Premium section.
Technology is selling off while other parts of the market rise
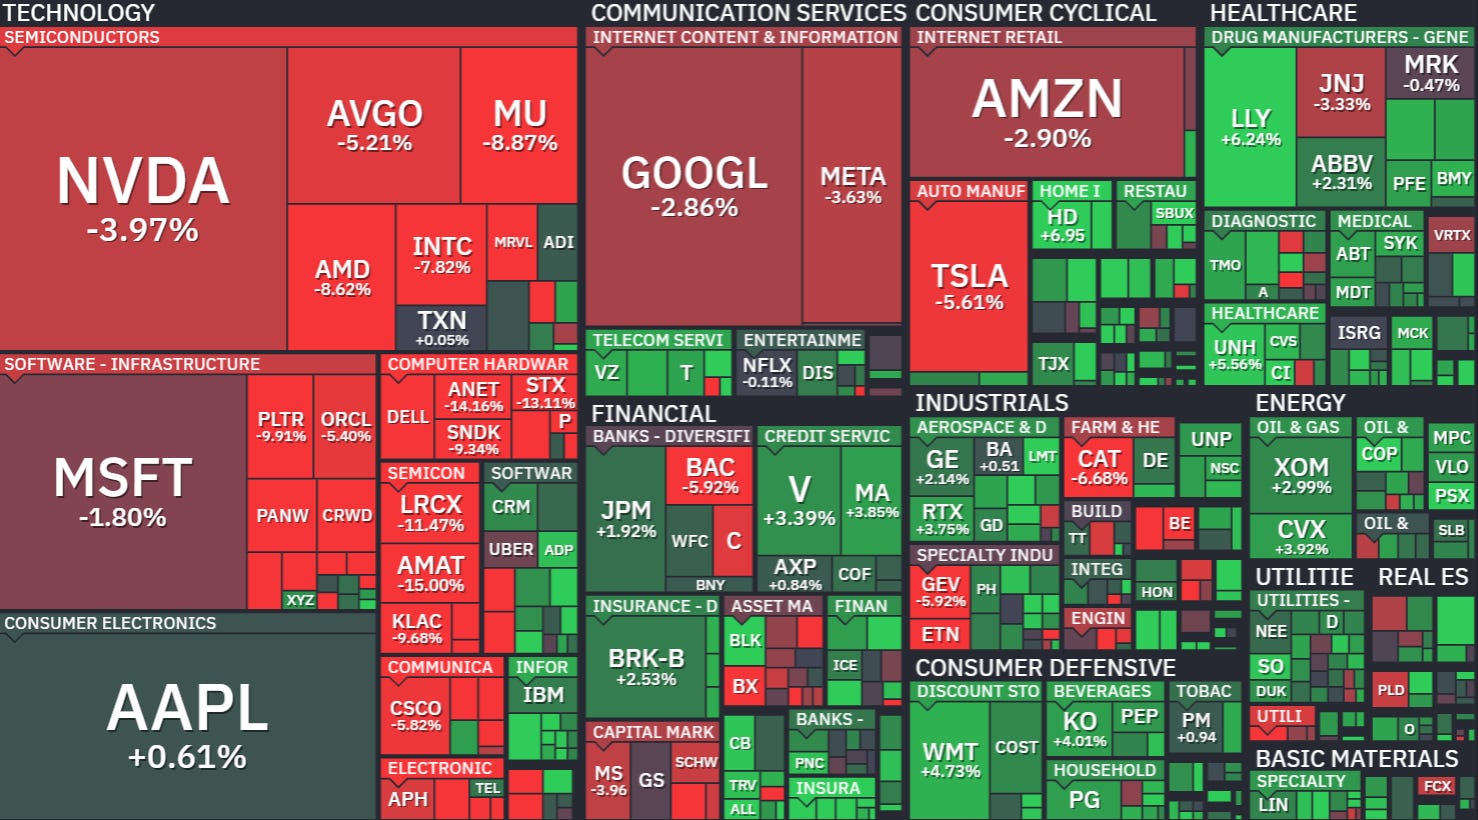
The latest weekly heatmap shows where the selling has been concentrated.
Nvidia fell approximately 7%, Broadcom 9% and Micron 15%.
Yet Walmart rose approximately 7%, Coca-Cola 7% and Berkshire Hathaway 3%.
These are very different outcomes inside the same market.
A technology-heavy portfolio can experience a much more severe decline than the broad index. An investor holding different businesses may barely recognise the same week.
For stock selection, the implication is straightforward: investigate what is happening to each company’s expected earnings and valuation. A red sector tile tells us where to look; it doesn’t establish what a business is worth.
The headline index is concealing a difficult year for many stocks
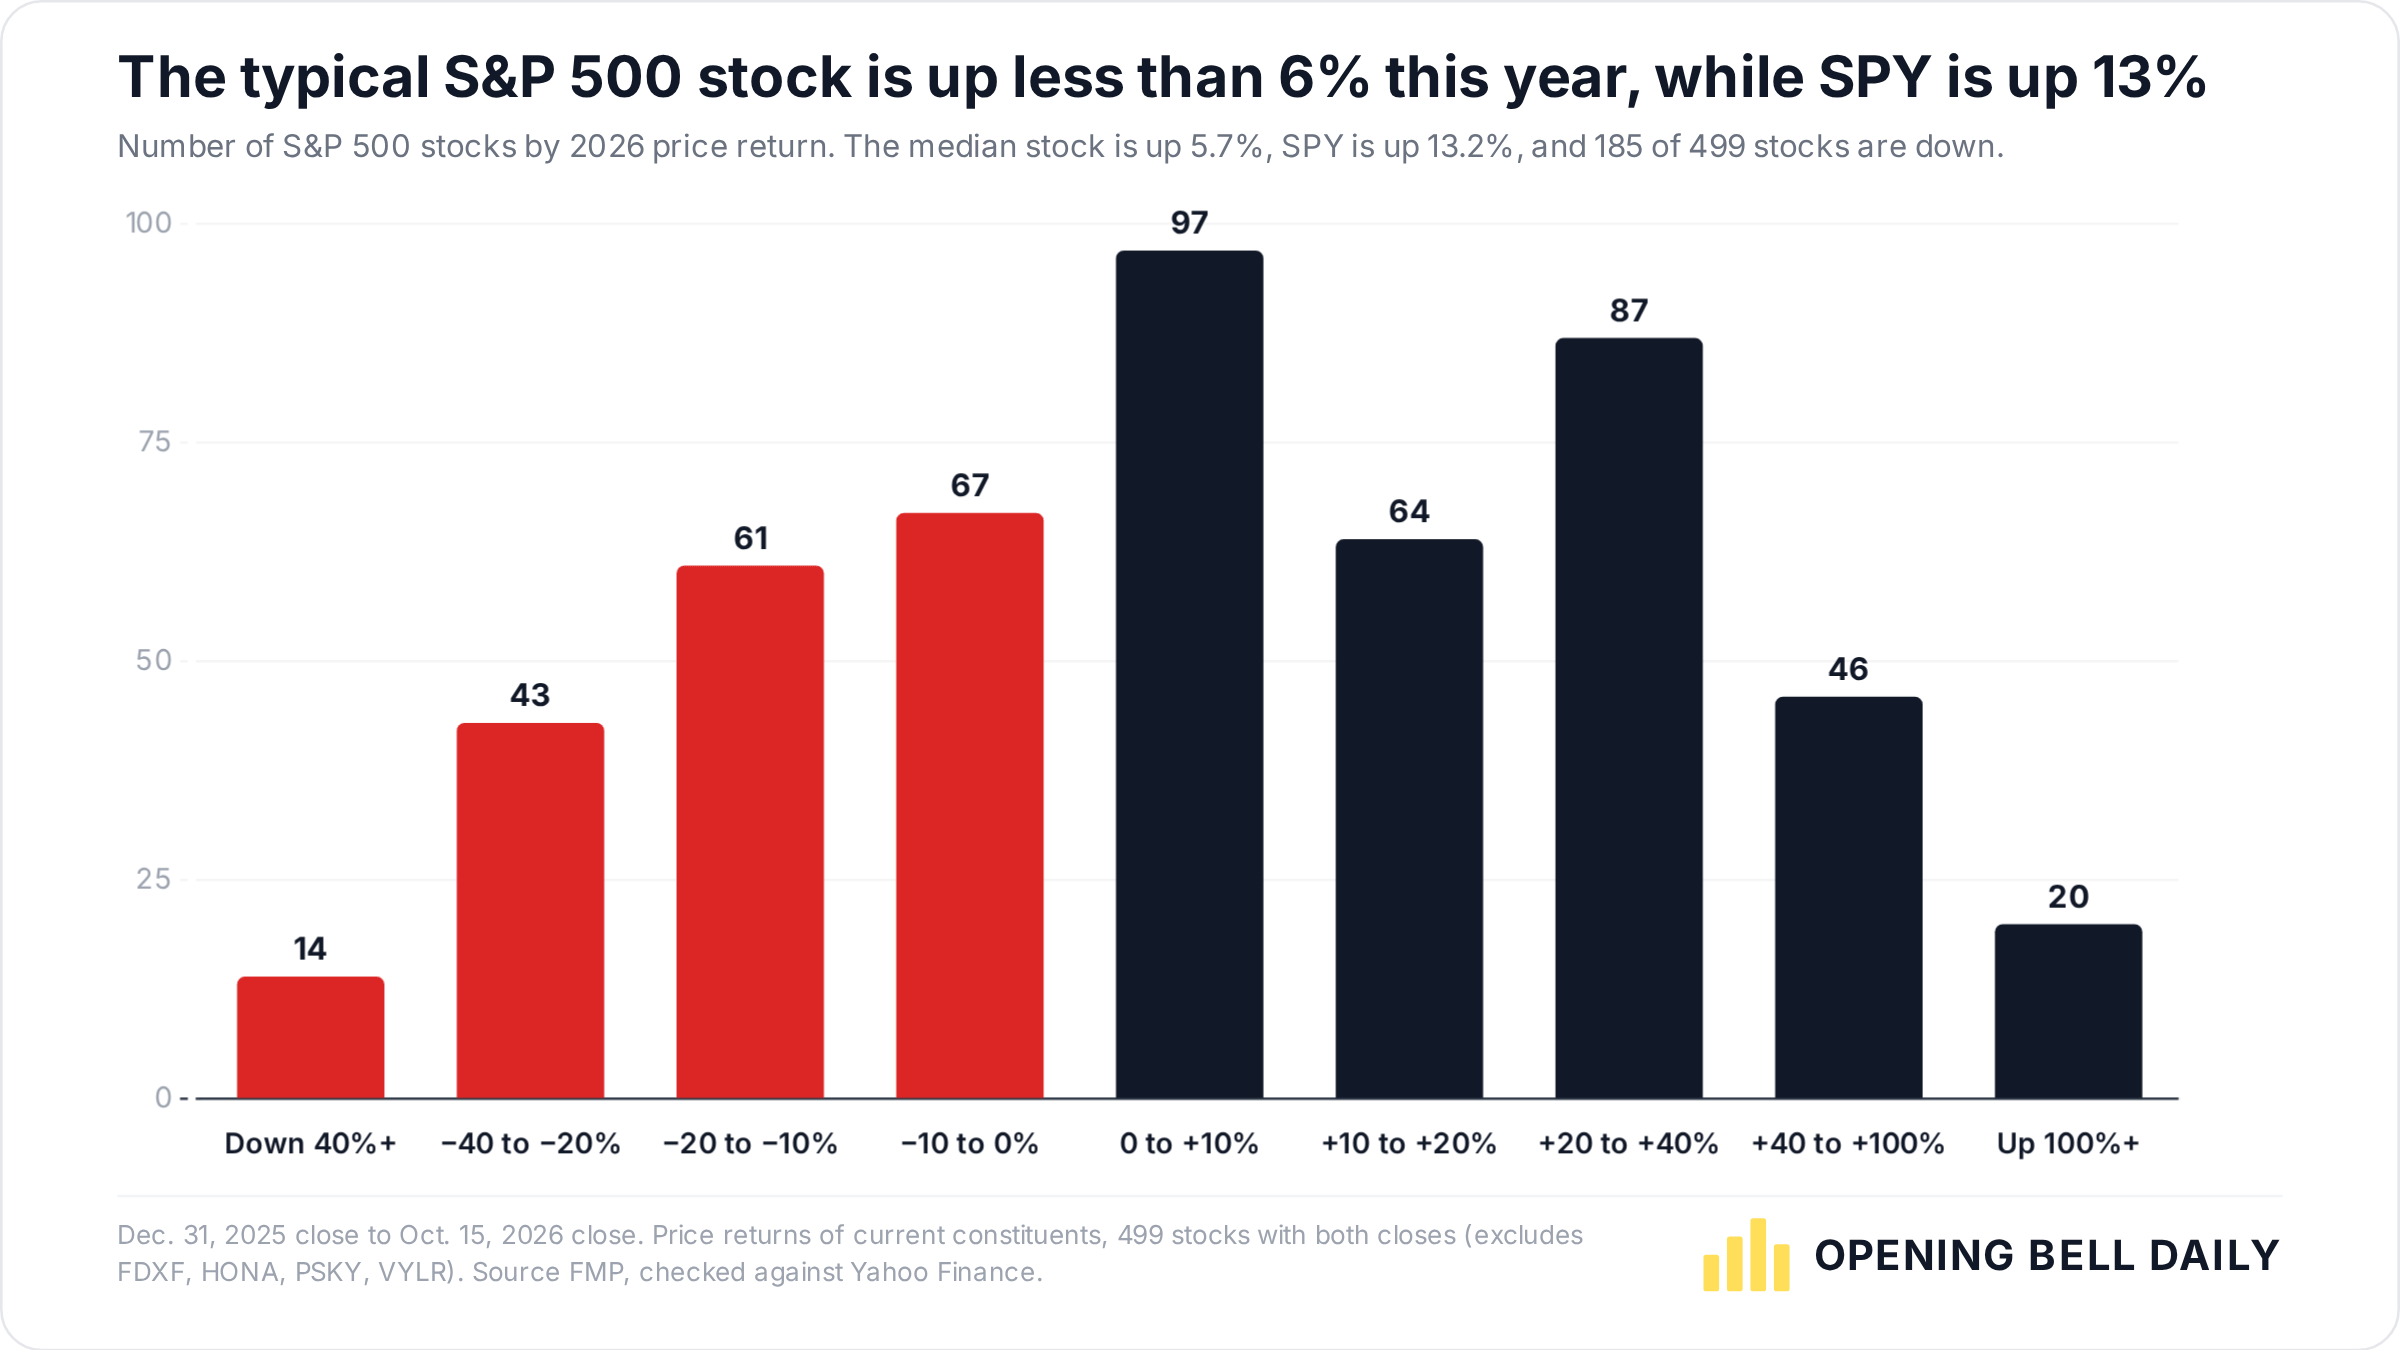
The year-to-date picture makes that distinction even clearer.
In this snapshot through 15 October, SPY was up 13%, while the median stock in the sample had gained 6%.
Of the 499 companies, 185 were down for the year. That is more than a third of the sample.
Index returns depend on the weights of the businesses inside them. Strong performance from large constituents can coexist with much weaker results elsewhere.
That helps explain why a rising index can still leave us with a substantial list of companies trading near their annual lows.
There is also an important distinction between the measurements: being down for the year, falling below a previous high and trading close to a 52-week low are three different things. The screen below uses the last of those.
October’s leadership has shifted
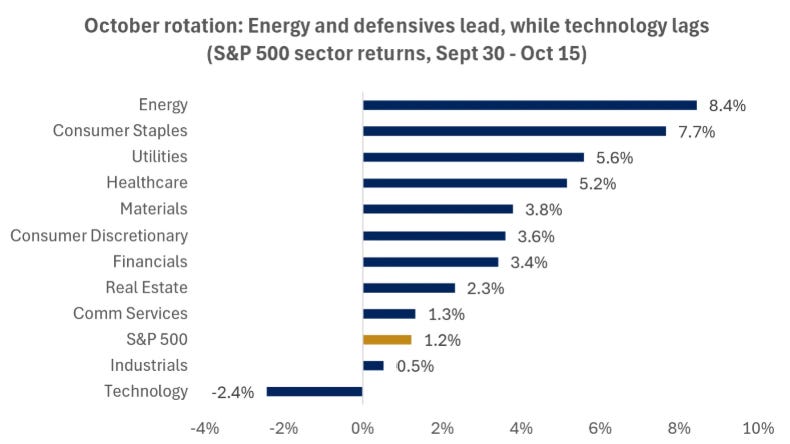
Between 30 September and 15 October, energy gained 8%, consumer staples 8%, utilities 6% and healthcare 5%. Technology fell 2%.
The rotation can be linked to higher rates, AI financing concerns and demanding revenue expectations.
For this research, that makes the balance sheet especially relevant. Two companies can both offer impressive growth forecasts while facing very different financing requirements.
I want to understand how much cash the business generates, what it needs to reinvest and how much debt it must support.
Earnings expectations remain strong
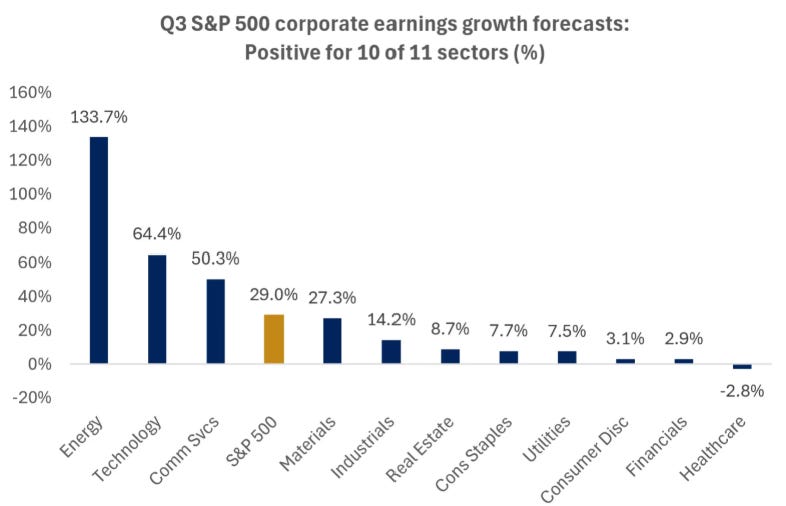
The earnings backdrop provides a useful counterweight to the selling.
The chart shows approximately 29% expected year-on-year S&P 500 earnings growth for Q3, with positive growth forecast for 10 of the 11 sectors.
Those figures include expectations that still need to be delivered. Strong aggregate growth also tells us little about the appropriate valuation for any one company.
I use the earnings backdrop as context, then test the forecasts behind each investment case. If the apparent discount depends on ambitious future profits, the downside scenario deserves particular attention.
What I take from this before buying anything
The market is giving us reasons to investigate, alongside reasons to be selective.
The useful response is to compare business performance with the change in price. I want to know whether the company can still generate the cash I originally expected, how much uncertainty sits inside that forecast and what return today’s price could offer.
That is why I’m looking across different sectors. The opportunity could emerge from a familiar growth business, an established dividend payer or a company whose recent problems have pushed expectations too low.
The valuation work has to decide which.
40 stocks trading near their 52-week lows
For this list, I used two simple entry requirements:
Market capitalisation above $10 billion.
A share price no more than 15% above its 52-week low.
Thirty-eight companies met those requirements in the company screen. I added Uber and Copart from my broader watchlist after checking that they met the same criteria.
This gives us a defined research universe containing both dividend-paying and non-dividend businesses.
The table is ordered by distance above the 52-week low. The closest stock to its low is not automatically the best investment.
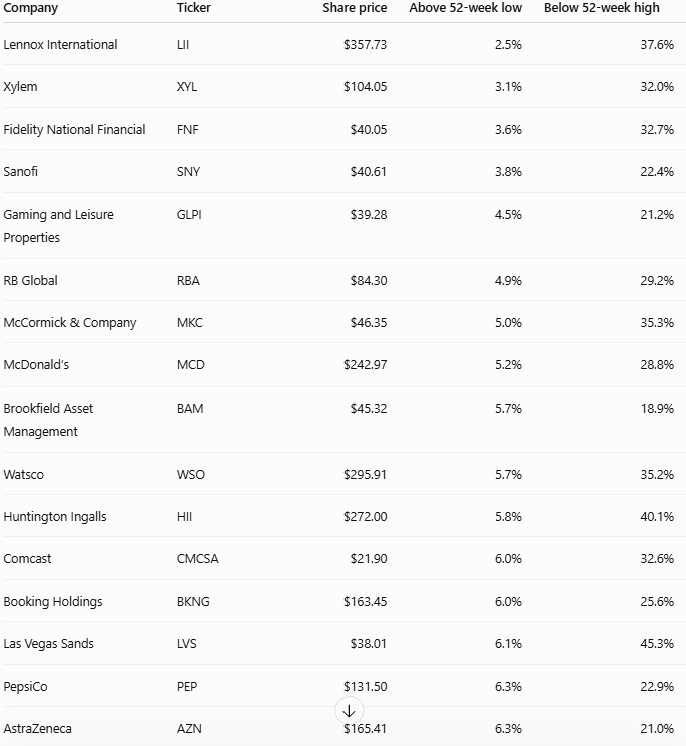
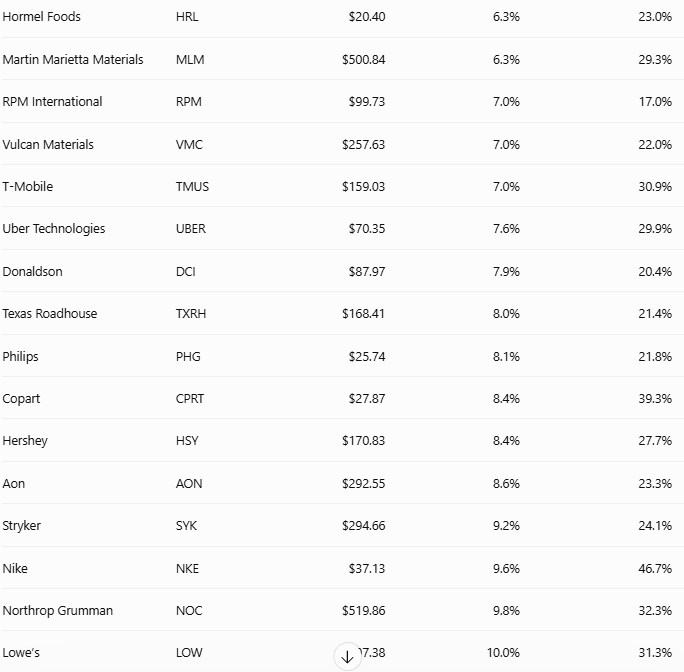
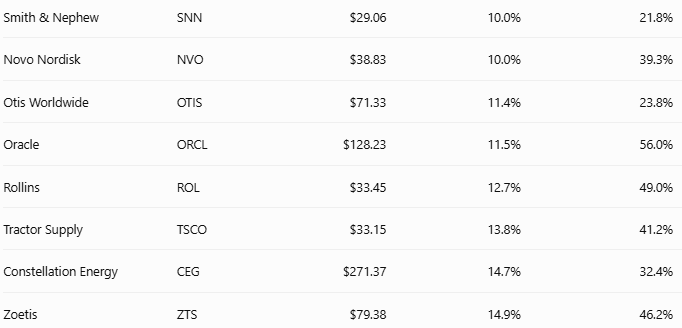
Save this list as a starting point for research. Inclusion tells us that a company meets the size and price-range requirements; the investment case still needs examining.
A large share-price decline can leave a surprisingly small valuation discount
Nike illustrates why the next step matters.
In this screen, Nike is 47% below its 52-week high. That is a substantial decline.
Yet the P/E measure is 28 times, against a five-year average of 29 times, a discount of only about 4%.
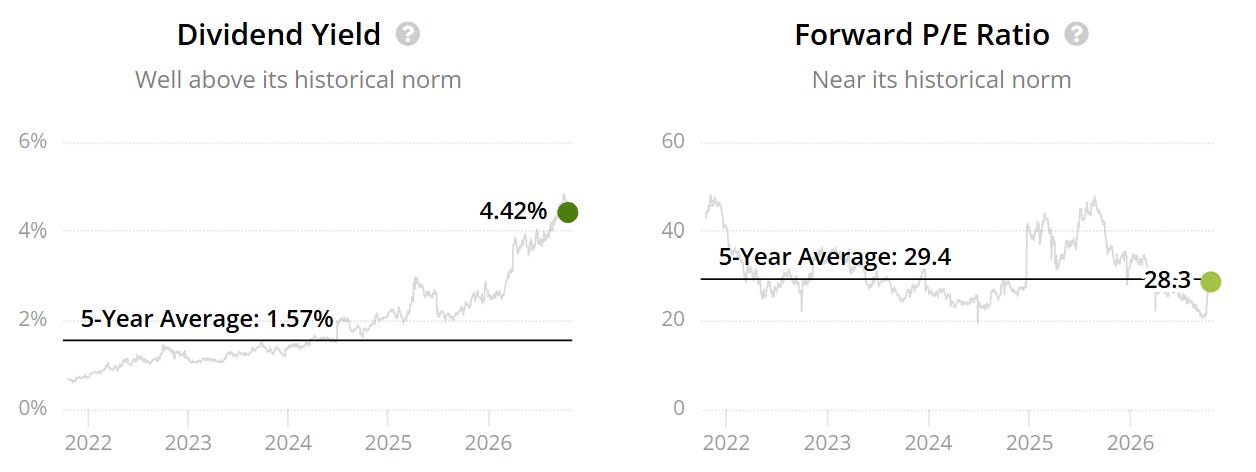
That observation alone doesn’t settle the investment case. It does show why the distance from an old share-price peak can give a very different impression from the earnings multiple.
A falling price needs to be assessed alongside the profits and cash flows investors can reasonably expect.
The five questions behind my shortlist
Would I want to own the business for the next five to ten years?
I look for a competitive position I can understand, attractive economics and a credible reason customers will keep choosing the company. A low multiple offers limited protection if the business keeps weakening.
What explains the fall?
A temporary disruption, a period of slower growth and a lasting loss of competitiveness require different assumptions. I want to identify the problem before deciding how much of a recovery to include.
What cash flow can shareholders reasonably expect?
The starting figure, forecast period and reinvestment requirements all matter. I test slower growth and examine whether reported cash generation gives a fair picture of the economics available to shareholders.
How much financial risk sits alongside that forecast?
Debt, interest costs and refinancing needs can reduce flexibility. I assess those obligations in the context of the business model and the consistency of its cash generation.
What price leaves enough room for the analysis to be wrong?
I use a fair-value range and a preferred entry price. Then I compare the opportunities on both valuation and business risk. The stock with the largest modelled upside may still require assumptions I’m less comfortable making.
My ranking, valuations and the prices I would pay
The shortlist needs to answer a practical question: where would I prioritise fresh money, and at what price?
For Premium members, the full analysis brings together:
My final ranking and the opportunities I would prioritise.
The business case and reason for the selloff behind each finalist.
Valuation assumptions and downside scenarios, including what changes when growth disappoints or the required return increases.
My fair-value ranges and preferred entry prices.
The main risk and next evidence to watch for each investment case.
The comparison is designed to make the decision easier to assess: the opportunity, the assumptions supporting it and the price that would make it attractive to me.