


September begins tomorrow.
And investors are heading into it with an unusual combination:
The S&P 500 remains close to record territory.
September has historically been the market’s weakest month.
The 30-year Treasury yield is above 5%.
The Federal Reserve is still concerned about inflation.
Employment growth is slowing.
Yet corporate profits and AI investment remain remarkably strong.
That makes this a difficult market to summarise.
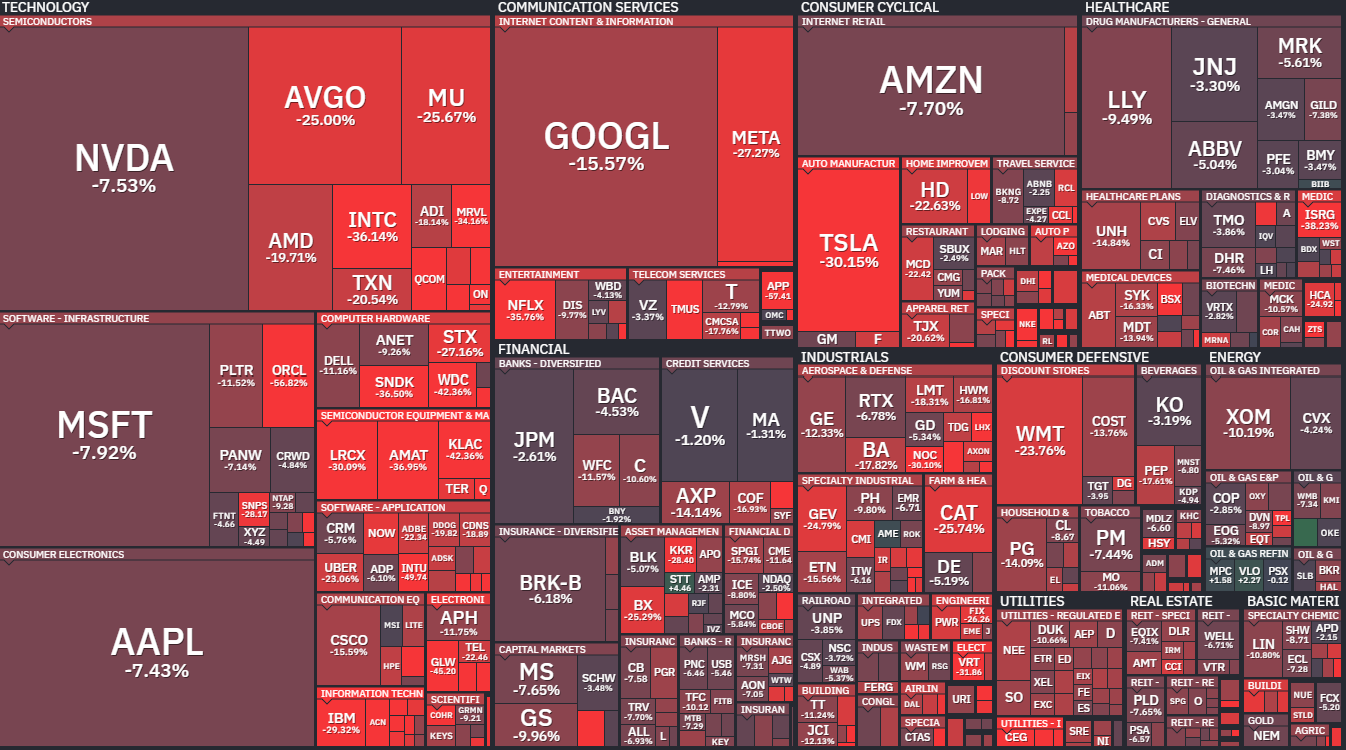
S&P 500 Heatmap - Drawdown From 52 Week Highs
It isn’t obviously cheap.
It isn’t obviously collapsing.
And underneath the index, individual stocks are producing completely different results.
So this weekend, I went back through a universe of 245 dividend-paying companies and ranked the 50 strongest opportunities heading into September.
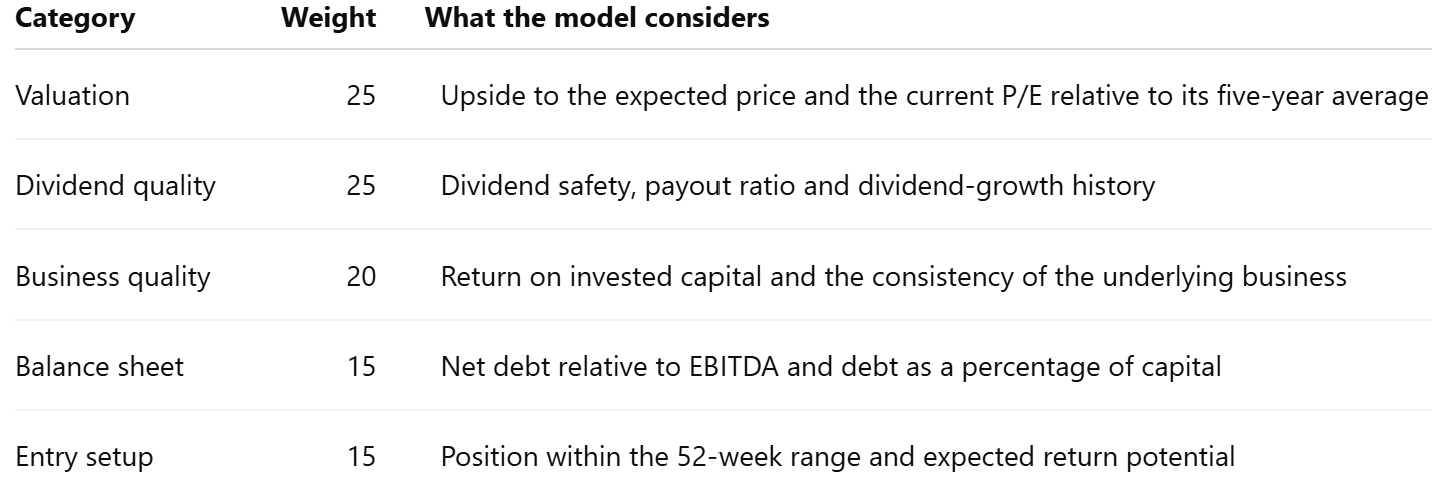
I scored each company across valuation, dividend quality, business quality, balance-sheet strength and its current entry setup.
But that was only the first stage.
Because once I took the quantitative results and compared them with the latest economic data, company earnings and the weaknesses built into any mechanical scoring system, I arrived at a noticeably different final five.
And I think the difference between those two rankings may be the most useful part of this entire exercise.
If you enjoy valuation-focused market analysis like this, subscribe to Dividend Talks. Free members receive my weekly research, while Premium members get my complete valuation work, stock rankings and downloadable research dashboards.
I started with 245 companies
The initial universe contained 245 dividend-paying companies.
To qualify for the final ranking, each company needed:
A market capitalisation of at least $5 billion
A dividend-safety score of at least 60
Positive free cash flow in at least eight of the last ten years
The qualifying companies were then scored across five categories:
The objective was not to create a perfect formula.
No formula can do that.
The objective was to apply one consistent framework across a large group of companies and identify where deeper research was most likely to be rewarded.
The 50 highest-ranked stocks
From the original 245-company universe, these were the 50 companies that scored highly enough to enter the final opportunity set:
ABT, ACN, ADP, AOS, BAH, BF.B, BR, BRO, CRM, CTSH
DIS, DLB, DOX, EFX, FDS, G, GGG, HRL, INGR, INTU
JKHY, KMB, LII, META, MKC, MKTX, MSA, MSCI, NKE, NVO
NVDA, OTIS, PEP, PG, PNR, POOL, RLI, RMD, ROL, SNY
SPGI, STE, STZ, TRI, TROW, TSCO, VRSK, XYL, YUMC, ZTS
These are not 50 recommendations.
They are the companies that survived the initial quality and financial-strength requirements before being ranked across valuation, dividend quality, business quality, balance-sheet strength and entry setup.
And the difference between merely qualifying for the list and becoming one of my final five is substantial.
Know another investor preparing for September? Share this 50-stock opportunity screen.
September’s reputation is well deserved
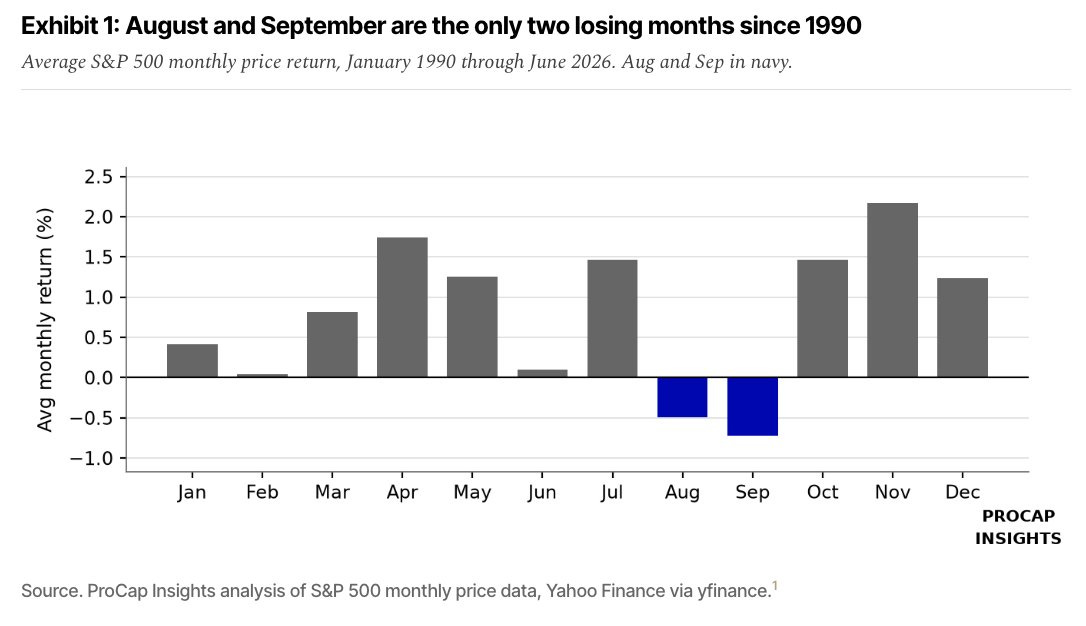
September has historically been the weakest month of the year for the S&P 500.
Based on monthly market returns since 1990, August and September are the only two months that have produced negative average returns.
September’s average decline has been approximately 0.7%.
That doesn’t mean the market must fall over the next four weeks.
Historical averages are useful for understanding tendencies, not for predicting exactly what will happen next.
September has delivered plenty of positive returns throughout market history. Selling simply because the calendar changes would be a weak investment strategy.
But seasonality can still matter.
Trading volumes tend to increase as investors return from the summer. Companies begin approaching the final quarter of the year. Economic expectations are reassessed. Portfolio managers reposition ahead of year-end.
And when valuations are already demanding, even a modest change in expectations can create significant volatility.
So I don’t view September’s history as a reason to sell.
I view it as a reason to know exactly what I would want to buy if volatility gives us the opportunity.
The bond market is the bigger concern
The more important development is happening in the Treasury market.
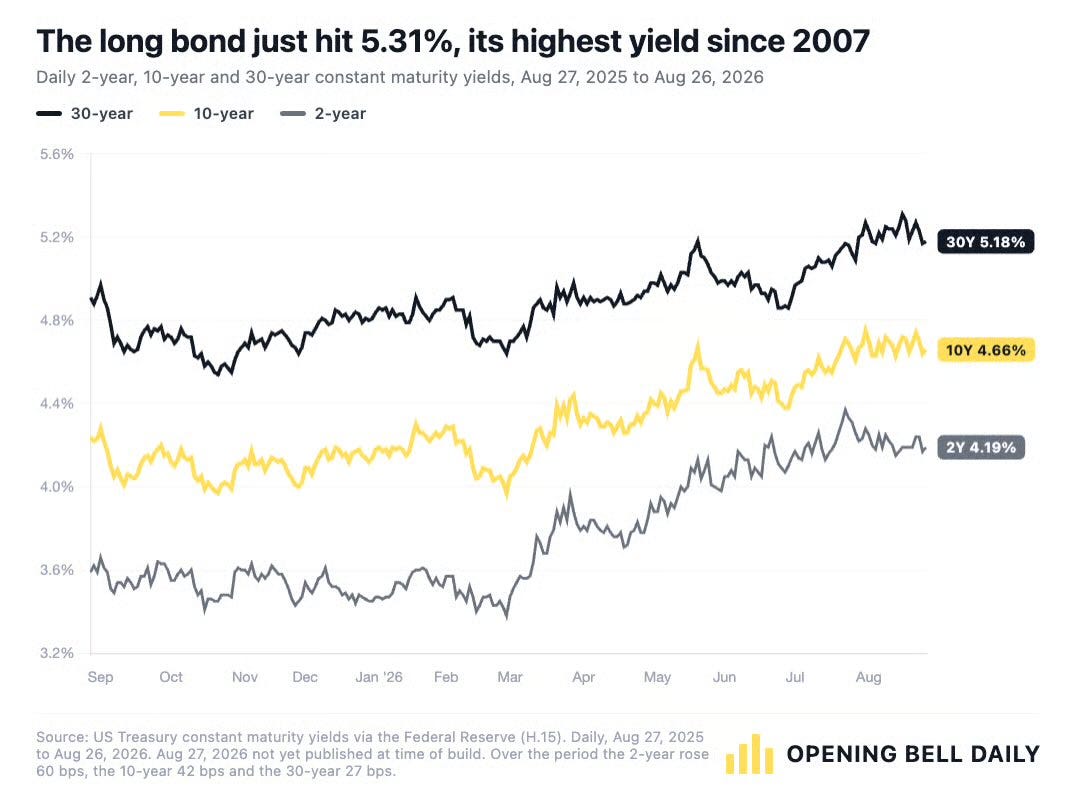
The 30-year Treasury yield recently reached approximately 5.2%, close to its highest level since 2007.
The 10-year yield has also climbed to approximately 4.7%, despite the Federal Reserve holding its target range at 3.50%–3.75%.
This matters because interest rates affect the value of almost every financial asset.
When long-term government bonds offered yields close to zero, investors had considerably less incentive to hold them. That helped push capital into equities and supported higher valuation multiples.
The situation today is very different.
If an investor can earn approximately 5% from a long-dated Treasury, a stock needs to offer a sufficiently attractive potential return to compensate for the additional uncertainty.
That doesn’t automatically make stocks unattractive.
But it raises the hurdle rate.
It also places considerably more pressure on companies whose valuations depend on cash flows arriving many years into the future.
Higher yields don’t affect every stock equally.
A company generating significant cash today may be able to absorb a higher discount rate. A highly leveraged business may struggle as borrowing costs rise. A company priced for exceptional growth may experience severe multiple compression if expectations weaken slightly.
That is one reason I don’t want to enter September simply owning whatever has performed best.
Price matters.
Balance-sheet strength matters.
And the assumptions already embedded in a company’s valuation matter more than ever.
The economy is sending conflicting signals
The latest economic data do not support a straightforward recession narrative.
But they don’t support complete complacency either.
According to the Bureau of Economic Analysis, real GDP increased at an annualised rate of 1.5% during the second quarter, down from 2.1% in the first quarter.
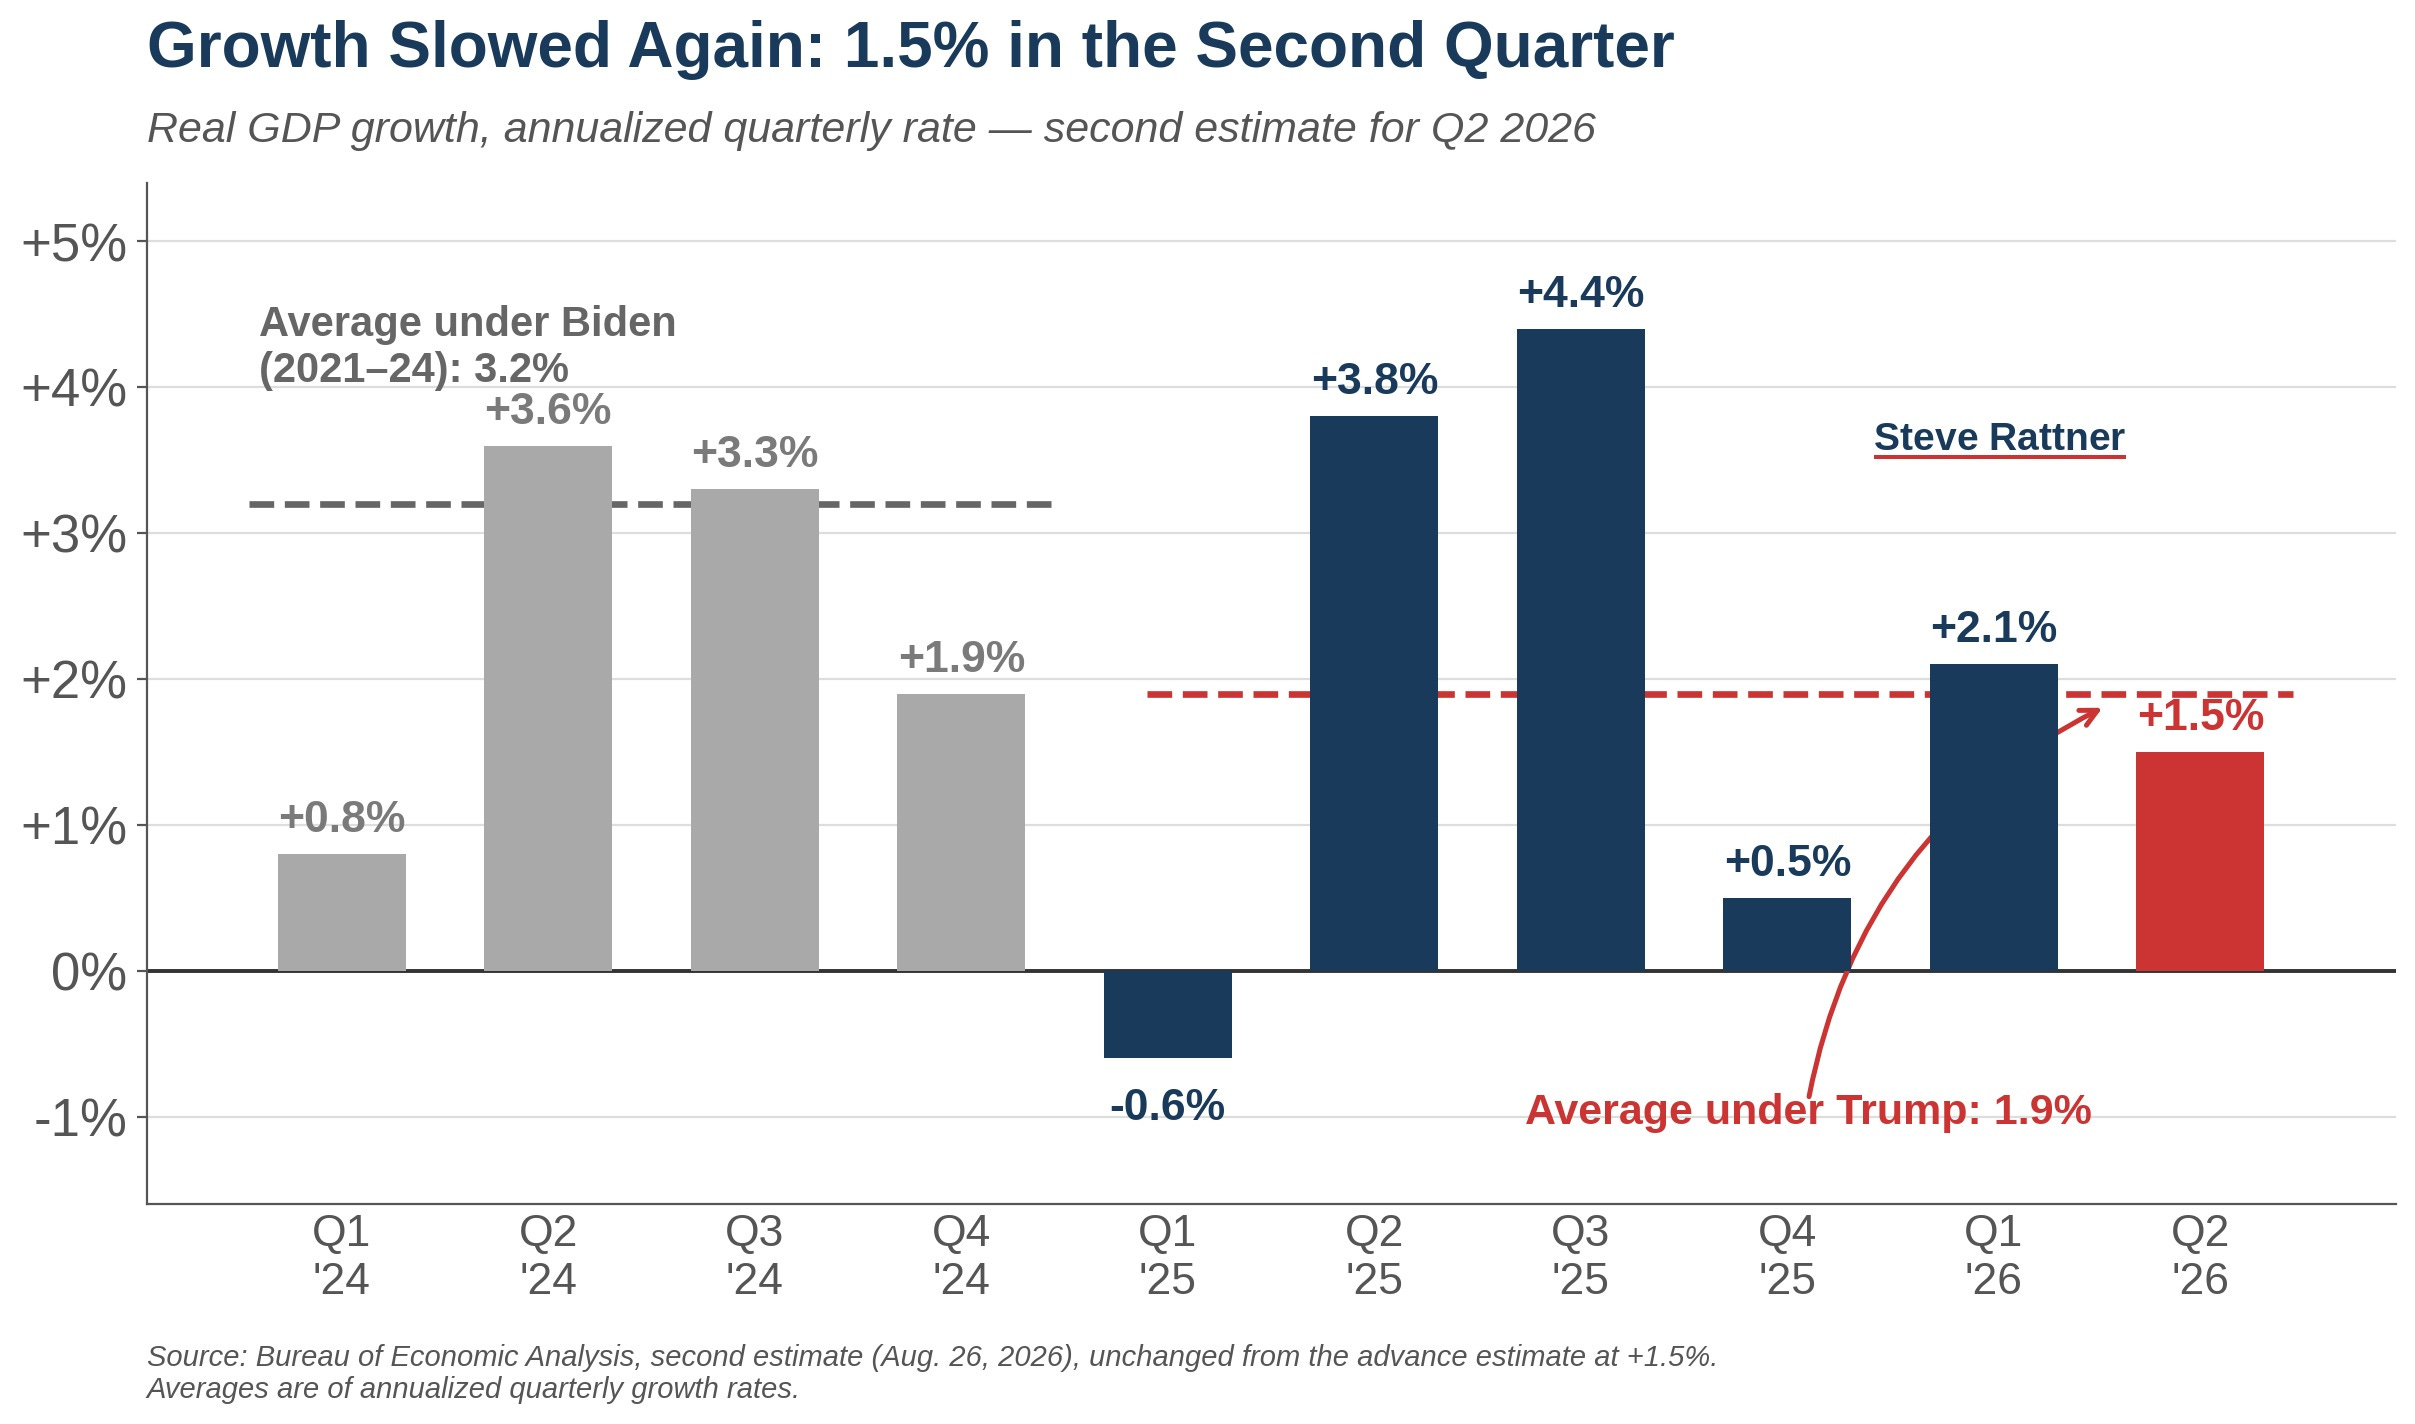
That headline suggests the economy is slowing.
However, real final sales to private domestic purchasers, a measure of underlying consumer and business demand, increased by a much stronger 4.2%.
Corporate profits from current production also increased by approximately $401 billion during the quarter.
So economic growth has slowed, but underlying private-sector demand and corporate profitability remain resilient.
The labour market presents a similar contradiction.
The July employment report showed payroll employment declining by 23,000. The May and June figures were also revised down by a combined 103,000.
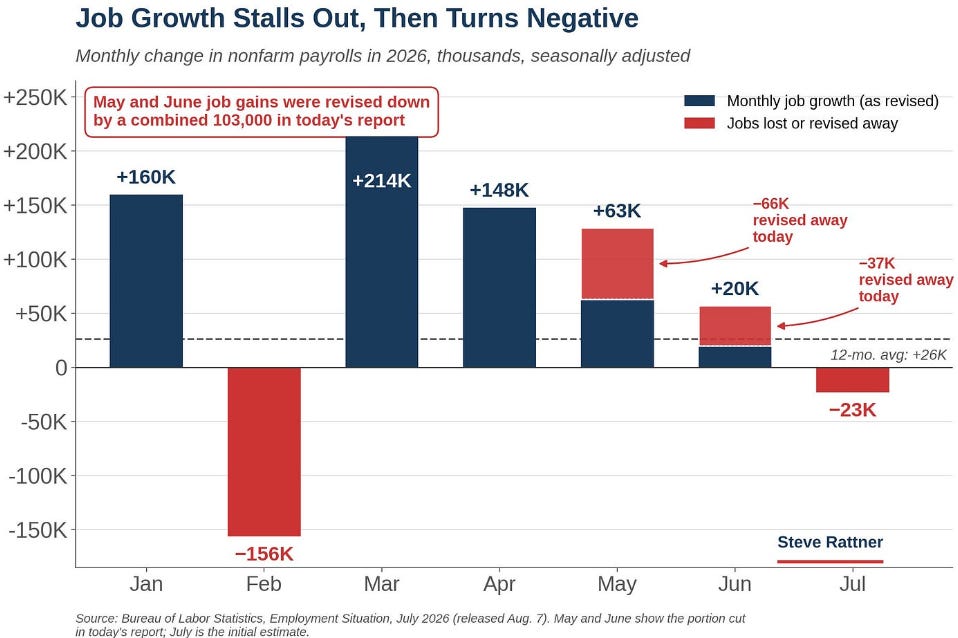
At the same time, unemployment remained relatively low at 4.1%, wage growth was still positive and initial unemployment claims remained subdued.
This is a labour market losing momentum, not one that has completely broken down.
That distinction will be tested again this Friday when the August employment report is released.
Why I didn’t simply select the five highest scores
A quantitative screen is an extremely useful starting point.
It forces consistency.
It prevents me from changing the rules simply because I like a particular company.
And it can uncover opportunities that might otherwise receive very little attention.
But a model can only measure what it has been designed to measure.
For example, this model rewards a long history of dividend growth. That is normally positive, but it can heavily penalise an exceptional company that has only recently started paying a dividend.
It penalises leverage, even when the business operates with recurring revenues, high retention and capital-light economics.
It uses historical returns and payout data that may not fully capture an ongoing business transformation.
And it cannot independently decide whether an apparently attractive valuation reflects temporary uncertainty or a permanent deterioration in the company.
That requires a second layer of research.
So after producing the quantitative ranking, I examined:
The latest company earnings
Revenue and free-cash-flow momentum
Competitive advantages
Capital-allocation priorities
Exposure to interest rates and economic activity
The reason each stock currently trades where it does
What the quantitative model may be missing
That changed the result considerably.
Only one company from the model’s original top ten remained in my final five.
The other four came from much further down the quantitative ranking.
This does not mean the quantitative model failed.
It means it did exactly what I wanted it to do.
It narrowed 245 companies to a manageable opportunity set, and then showed me where the numbers required more investigation.
Which five made the final cut?
Only one of the screen’s ten highest-ranked companies made my final five.
Below, I explain which businesses moved up the list, why I prefer them and what would change my view. Premium members also receive:
My final five in order of research conviction.
Each company’s DCF valuation, assumptions and sensitivity tests.
The complete 50-stock quantitative ranking.
The downloadable September workbook covering all 245 companies.
The stock names are a starting point. The paid research explains what I think they are worth, and what has to go right to justify that valuation.
Become a Premium member to read the final five and download the September dashboard.