


I’ve been away for much of September, so it has been nearly a month since my last ranking. Coming back to the market, one contrast stood out.
Stocks have been rising at the same time that the price of borrowing has been rising.
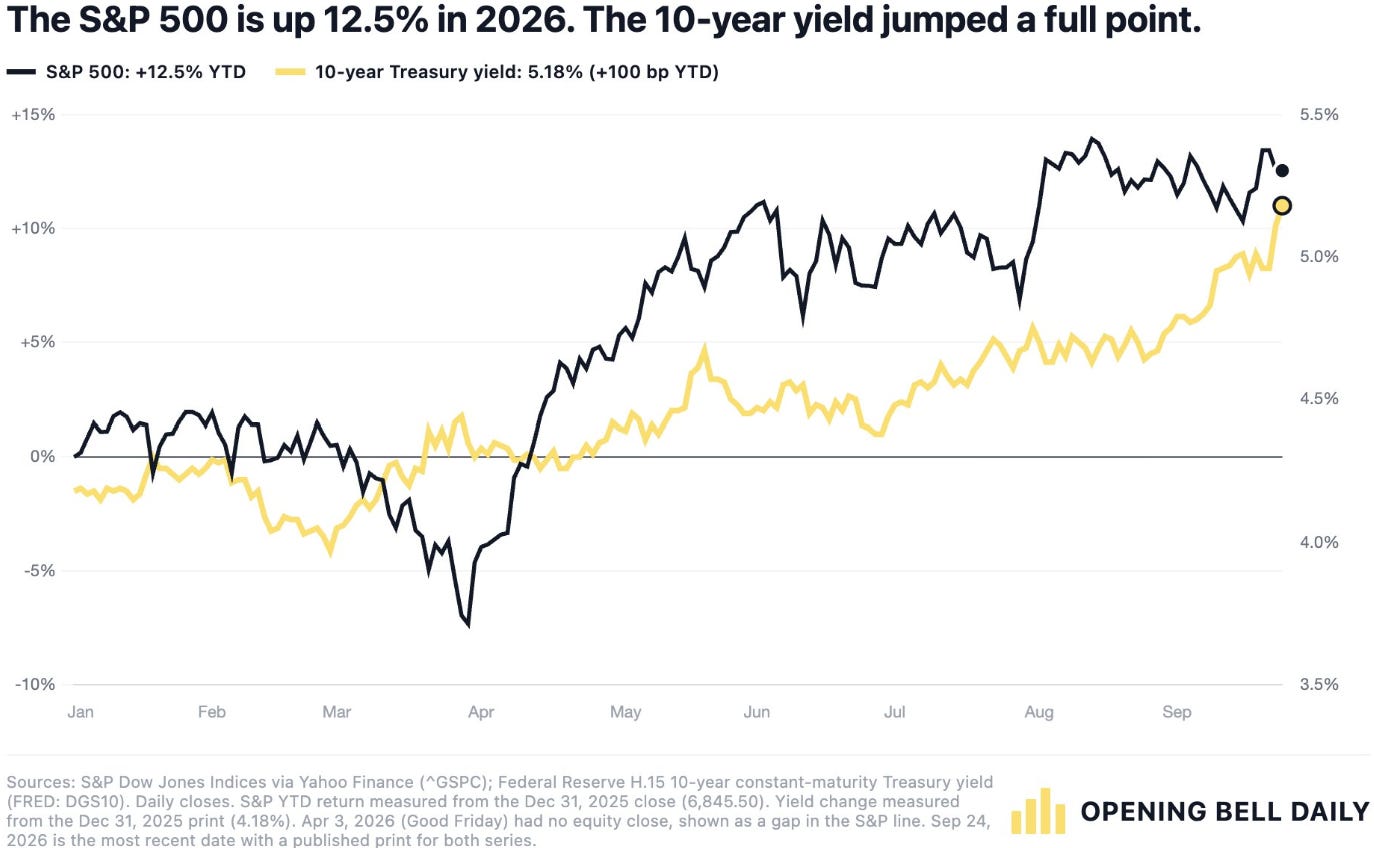
The S&P 500’s 2026 gain alongside the rise in the 10-year Treasury yield.
That combination changes how I look at a stock. A 3% dividend yield needs to be judged against the return available elsewhere. A low P/E is interesting only if the earnings behind it remain durable. And a business promising years of growth needs enough growth to justify paying for those years today.
Why both stocks and yields have risen
Part of the rise in yields is an inflation story. The latest published core PCE inflation reading was 3.3%, still above the Fed’s 2% goal. On 16 September, the Fed raised its target interest-rate range by a quarter point to 3.75%–4.00%. Its statement described solid economic activity, resilient spending and robust capital investment alongside elevated inflation.
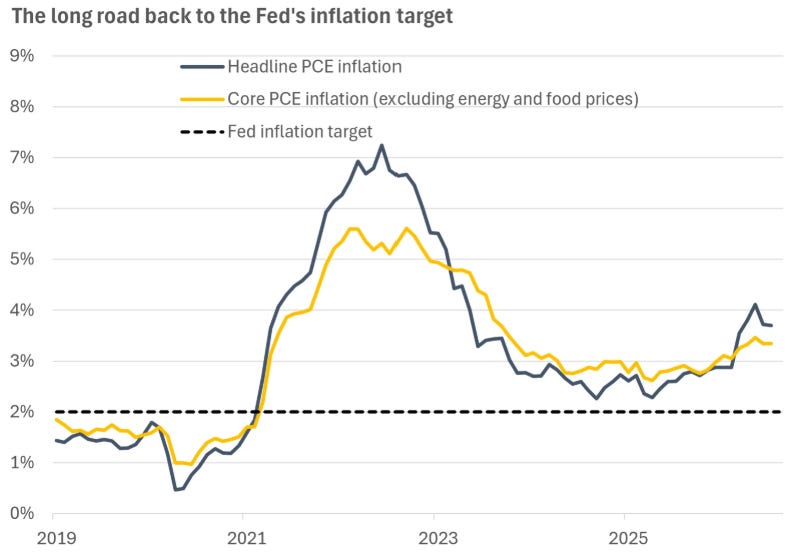
Headline and core inflation have moved further away from the Fed's 2% target
But higher yields do not, by themselves, tell us that company earnings are falling. The Goldman Sachs chart I shared below shows S&P 500 trailing four-quarter earnings per share up 26% over the past year. That is a backward-looking measure, and it does not promise another year of growth. It does help explain why the index has been able to withstand a much higher bond yield so far.
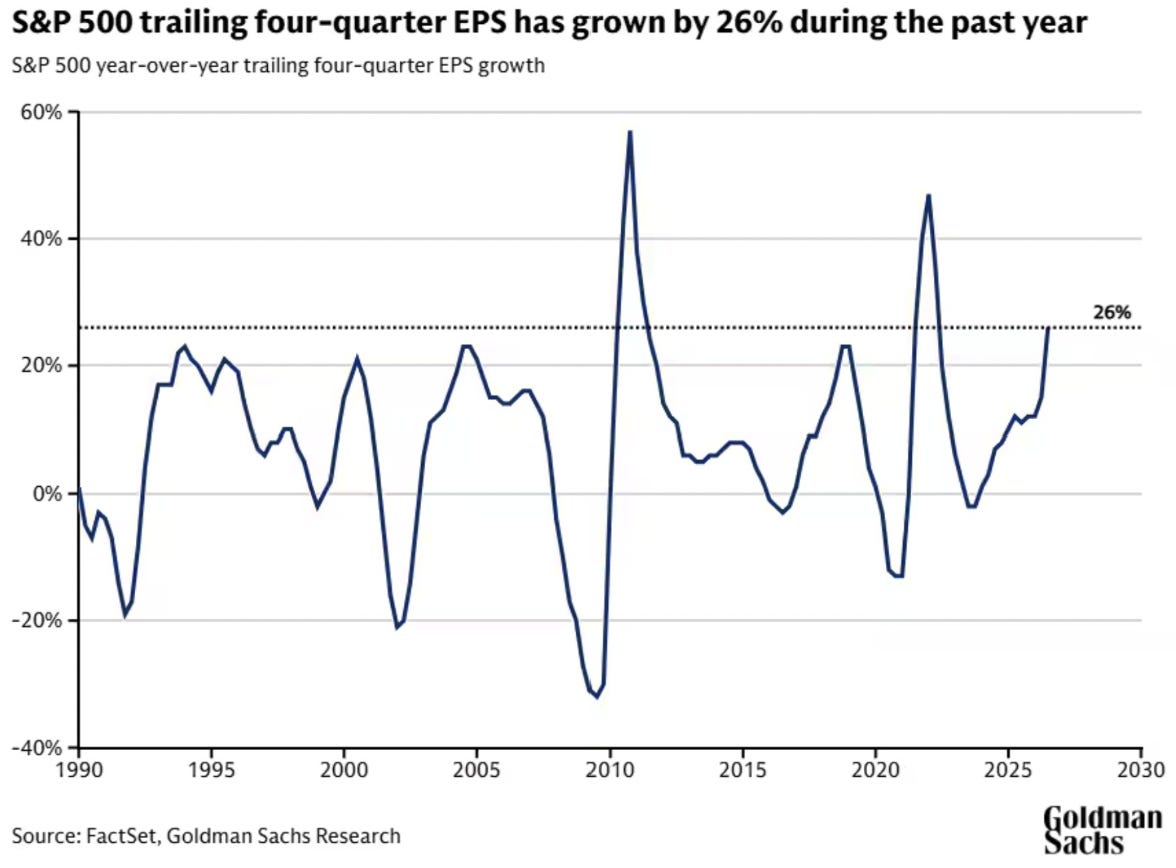
Trailing four-quarter S&P 500 EPS growth.
So I am wary of two easy conclusions: that higher rates must end the stock rally, or that strong index earnings make every stock attractive. The earnings and the valuations have to be tested company by company.
The index is not the whole market
The Nasdaq breadth chart below is the reason I do not want to stop at an index return.
The index is near its highs while the measure of new 52-week highs minus new 52-week lows had turned negative.
That is a dated snapshot, not a prediction of a crash.
It shows how a strong headline index can sit alongside weakness in a wider group of stocks.
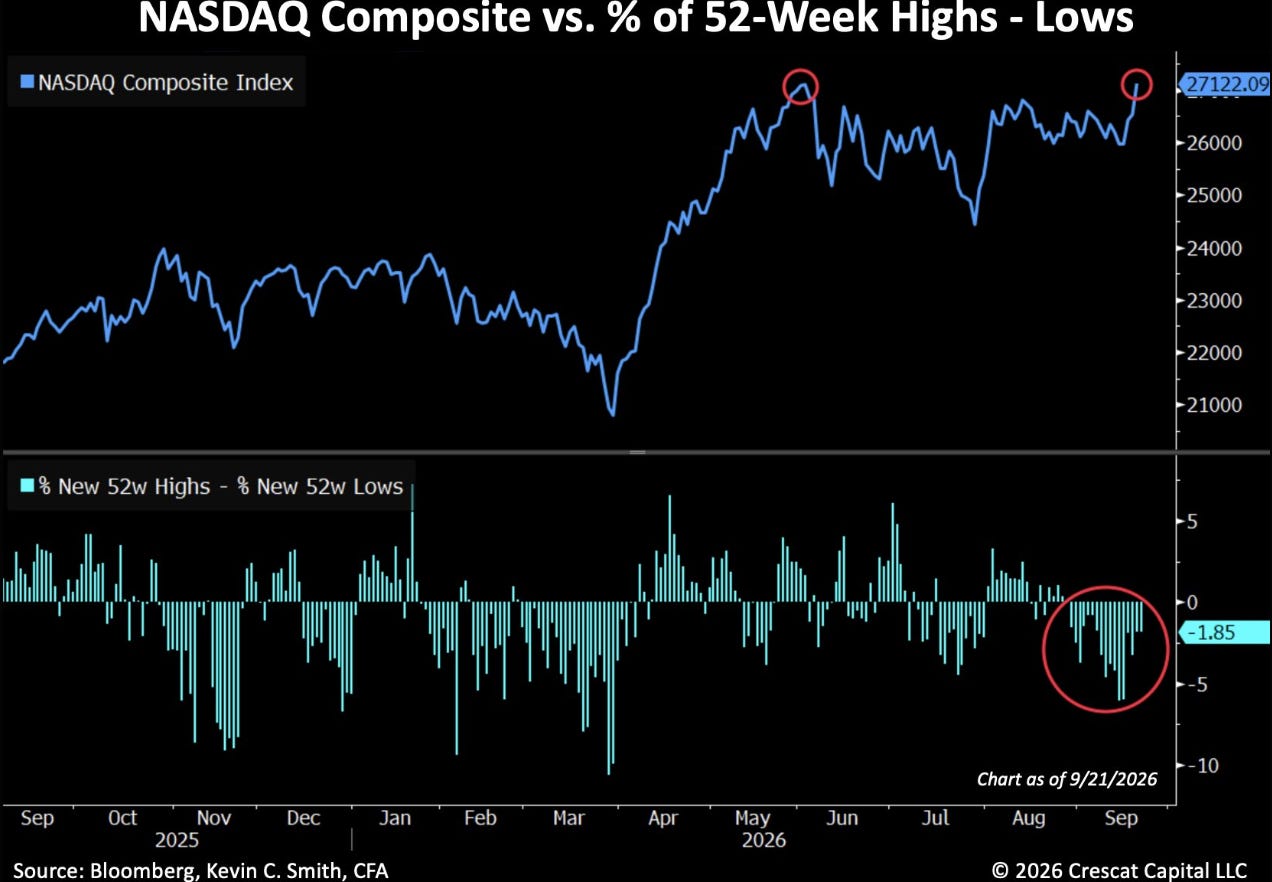
Nasdaq Composite and the percentage of new 52-week highs less new 52-week lows.
For October, I wanted to look across that divide. Some companies have strong earnings but offer little current income. Others offer unusually high yields because investors have become less confident about growth. Rate-sensitive businesses may look cheaper while facing a genuinely harder operating environment.
That is exactly when a ranked list becomes useful, provided I am willing to challenge its results.
I started with 217 companies
My latest export contained 217 dividend-paying companies. I first required each to have:
A market value of at least $5 billion
A dividend-safety score of 60 or higher
Positive free cash flow in at least eight of the past ten years
160 passed. I scored those companies out of 100 across valuation (25 points), dividend quality (25), business quality (20), balance sheet (15) and entry setup (15). The highest-scoring 50 became my October research list.
The model imposes discipline. It does not know whether an old P/E average still describes today’s business, whether a higher yield reflects an opportunity or a warning, or whether the next earnings report could change the case. Those are the questions behind my final five.
The October 50
These are the top 50 in alphabetical order.
Making this list means research it further. It does not mean buy it today.
ABT, ACN, ADP, AON, AOS, BF.B, BR, BRO, CBOE, CMCSA
CSL, CTSH, DLB, DOX, FDS, FNF, G, GGG, HRL, INGR
INTU, JKHY, KMB, LII, LOW, MCD, MKC, MKTX, MRSH, NVDA
NVO, PAYX, PEP, PNR, POOL, RELX, RLI, RMD, ROL, SNY
SPGI, STE, STZ, SYK, TRI, TSCO, VRSK, XYL, YUMC, ZTS
The model’s number one did not make my final five
Novo Nordisk ranks first with a score of 93.2/100. It’s priced at $38.80 and a 11.9 P/E, against a five-year average P/E of 30.1. On a valuation screen, that is difficult to ignore.
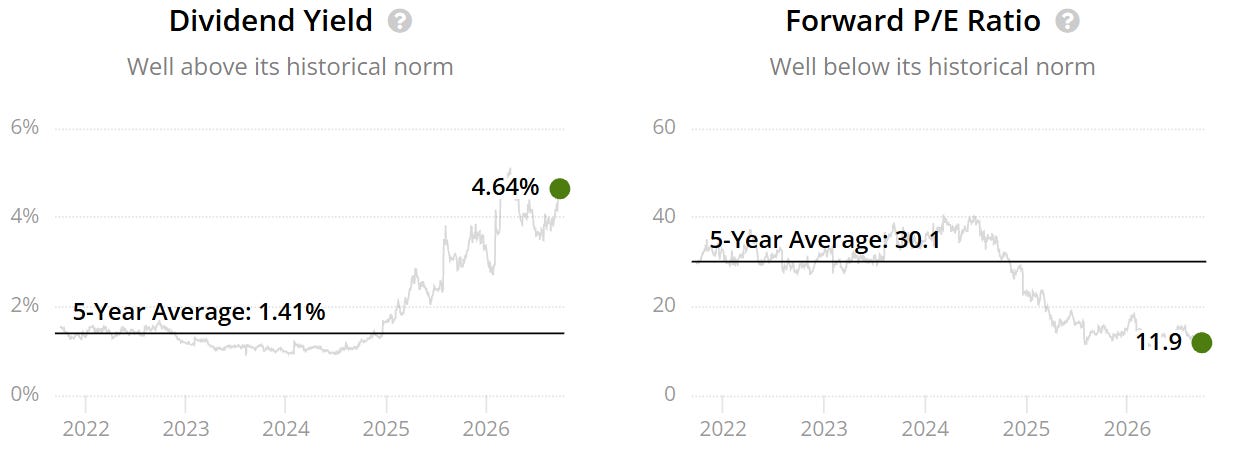
Then I checked what the company says about this year.
Novo raised its 2026 outlook in August, but its updated guidance still calls for adjusted sales and adjusted operating profit to be flat to down 6% at constant exchange rates.
That does not rule out a recovery. It does mean I cannot simply apply the old 30.1 multiple to today’s earnings and call the result fair value. The data’s $98.35 “Expected Price” is a screening reference; it is not my discounted cash flow valuation or an automatic target.
This is the difference between a stock appearing cheap on a spreadsheet and having a price at which I am prepared to act.
Where my October research led
I took the 50-stock list through a second review and chose five businesses to investigate most closely. They are not simply the first five names on the model. Each has a different source of potential return, a different risk, and a different reason its current price may or may not be good enough.
For paid readers, the rest of this report includes:
My five in order, with the screen rank beside my rank
The current evidence and main risk behind each decision
Bear, base and bull scenarios, with the earnings and P/E assumptions stated
A research entry price and the specific development that would change my view
The downloadable October Excel dashboard, including all 217 companies, the recalculating top 50 and an editable scenario model
I will not force a Buy rating simply because it is time for a new monthly article. The valuable decision may be to act, to wait for a price, or to wait for better evidence.
Below, I show which applies to each of my five.