

A familiar business. A very different price.
McDonald’s has become the kind of stock investors often say they want until the opportunity arrives with uncomfortable headlines attached.
The shares have sold off. The dividend yield has risen. The earnings multiple has fallen well below its recent average.
Yet the business is still generating substantial profits and cash flow.
That creates a useful question: is the market giving us a better price for a durable business, or adjusting to a weaker future?
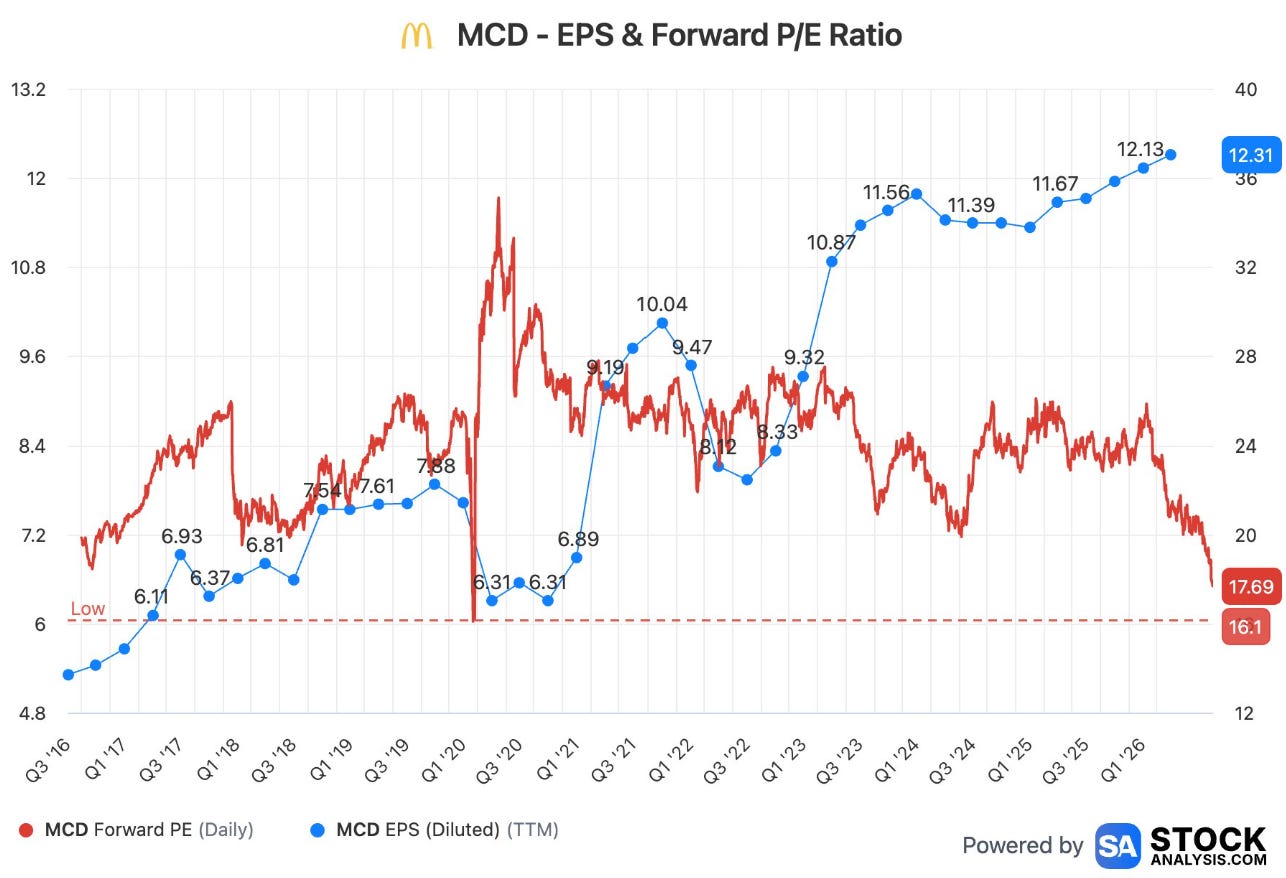
This chart captures the tension. Trailing earnings have generally moved higher, while investors are paying much less for those earnings.
But a lower multiple only becomes an opportunity if the future earnings behind it remain credible.
I’m going to work through the selloff, the franchise model, the dividend and the valuation, then finish with the price at which I would be more comfortable buying.
This entire analysis, including the valuation and buy-price conclusion is free. Join 17,000+ readers for more research on dividend stocks, quality businesses and valuation.
Why a strong market can still leave dividend investors frustrated
An index can perform well while individual stocks struggle. The market map below shows the gap between areas attracting capital and companies facing more difficult conditions.
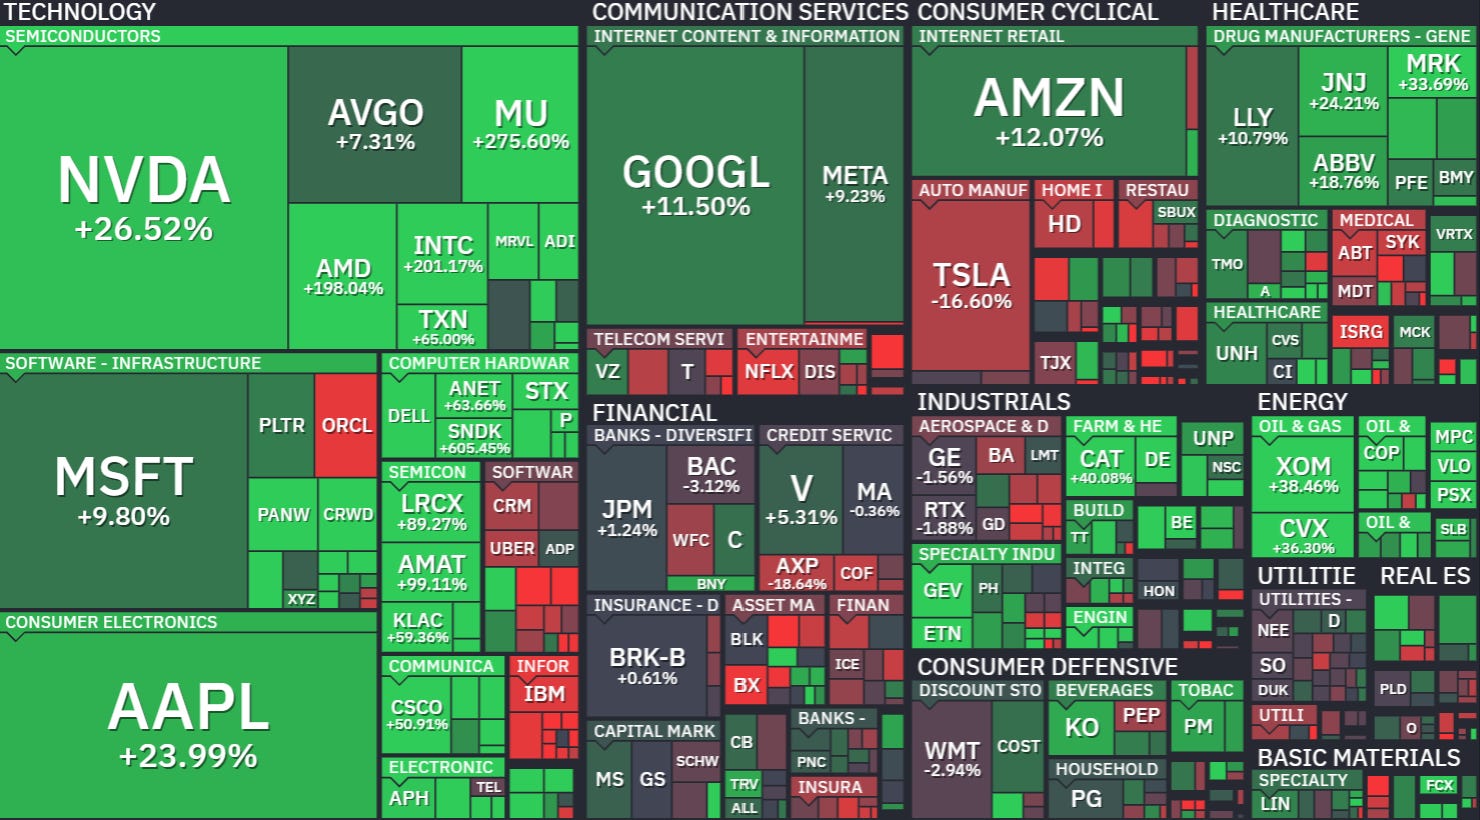
For a dividend investor, the temptation is to look at the neglected stocks and assume capital will eventually rotate back.
Sometimes it does. But neglect alone is insufficient: a company needs earnings, cash flow and a sensible purchase price to reward that patience.
McDonald’s also faces a consumer spending problem. A familiar brand and convenient locations help, but customers can reduce visits, choose a cheaper order or spend elsewhere. A business can retain its competitive advantages while delivering disappointing growth.
The longer-term return chart makes the cost of paying too much more tangible.
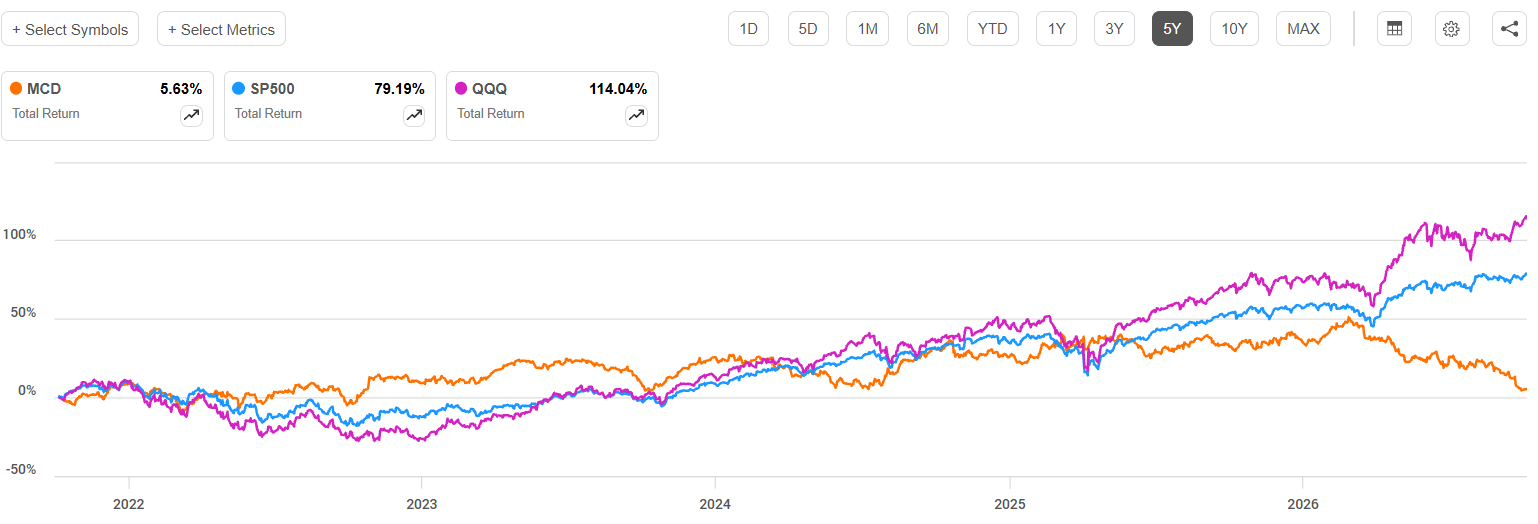
These are total returns, including dividends. Over this particular five-year window, McDonald’s has substantially lagged both benchmarks.
That does not predict the next five years. It does challenge the idea that buying a famous dividend stock automatically produces a good investment result.
The business you buy matters. So does the valuation you pay.
What shareholders actually own
McDonald’s is primarily a franchisor. Approximately 95% of its restaurants were franchised at the end of June 2026. Its revenue includes franchise fees, rent and royalties, alongside sales from the restaurants it operates itself.
This distinction matters. Franchisees carry much of the day-to-day restaurant responsibility, while McDonald’s benefits from the brand, operating system and recurring franchise income.
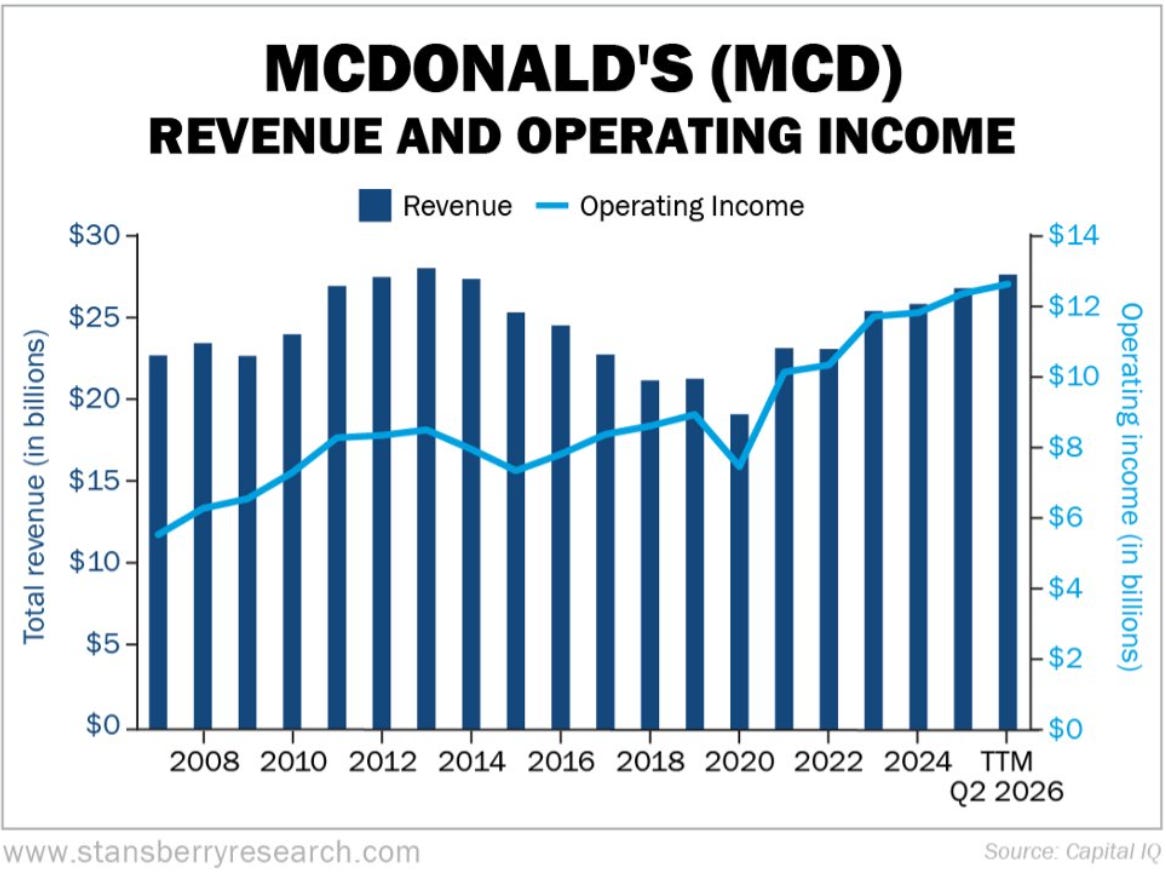
Revenue has not followed a smooth upward line. Operating income tells a more encouraging long-term story.
The franchise structure helps explain why. Moving a restaurant from company ownership to a franchise arrangement can reduce reported revenue while improving the economics of the income McDonald’s retains. Company revenue and total restaurant sales are different measures.
It would therefore be a mistake to judge this business solely by the revenue bars.
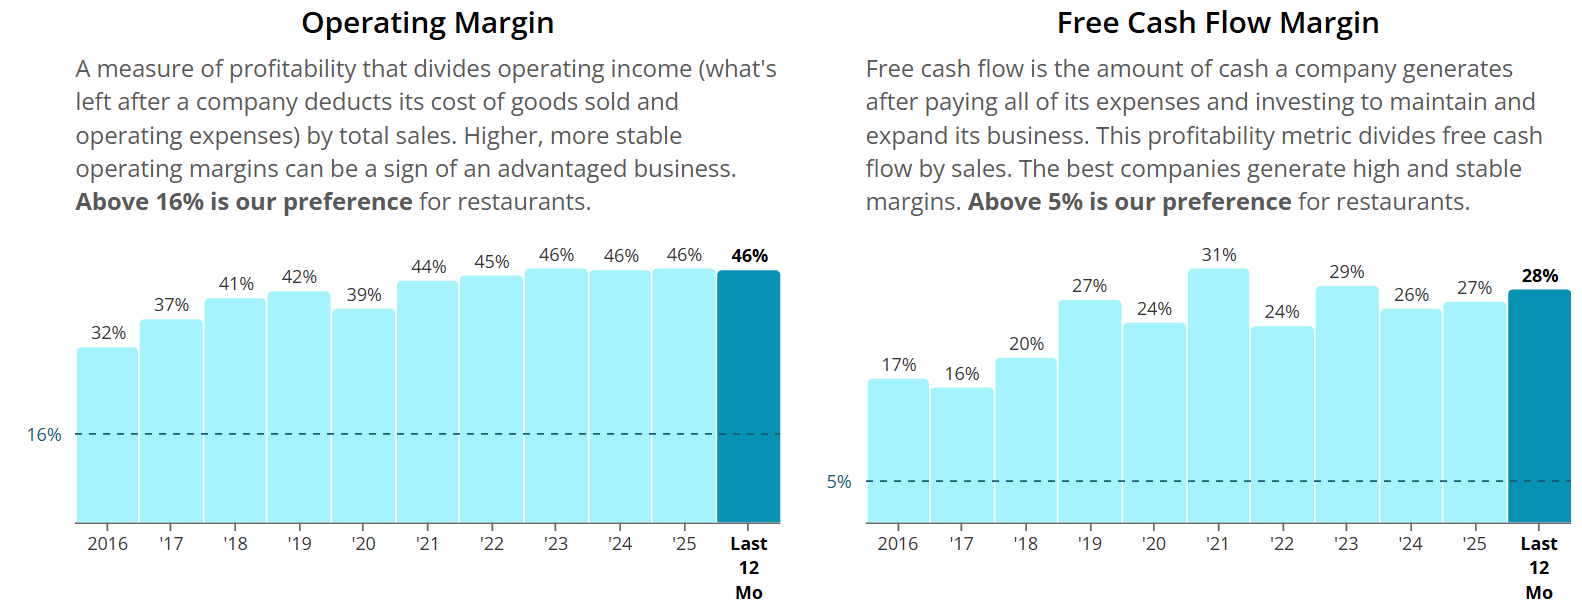
The data shows a highly profitable business. An operating margin near 46% is a meaningful strength, and cash generation remains substantial.
These are corporate margins. They are not the margins earned by a typical franchisee selling burgers and paying restaurant wages.
That distinction becomes particularly important when we examine the new investment plan: a profitable parent company still needs financially healthy restaurants beneath it.
The problem: higher sales do not necessarily mean more customers
The clearest operating concern is the slowdown in comparable sales.
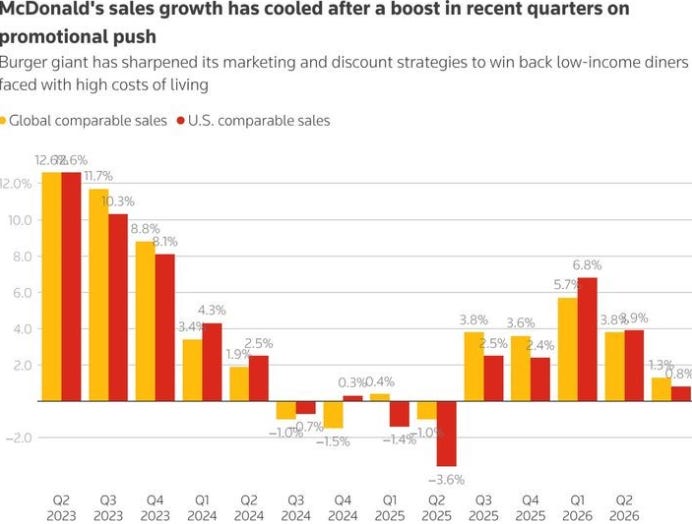
In the second quarter, global comparable sales grew 1.3%, while U.S. comparable sales grew just 0.8%. Adjusted earnings per share increased 6% to $3.38.
Those results show why both sides of the debate have something to work with. Earnings are growing, but restaurant sales momentum is weak.
The U.S. sales increase was supported by average spending per transaction, while comparable guest counts declined. In plain English, sales can rise slightly even when fewer transactions take place.
I want to see customers returning more often, rather than relying mainly on price and product mix to support growth.

McDonald’s appointed Skye Anderson to lead its U.S. business in August. The company’s own commentary acknowledged the need to improve execution in its largest market.
A leadership change can help. The evidence that matters will be better service, stronger customer value and improving traffic not the announcement itself.
Wall Street has also been reducing expectations.

KeyBanc lowered its target from $305 to $280 while retaining an Overweight rating. Its revised outlook incorporated softer U.S. trends.

Guggenheim lowered its target from $290 to $250 and retained a Neutral rating, citing softer U.S. same-store sales, slowing unit growth and reinvestment.
A target above the share price can look reassuring. But when that target is falling, the more important question is whether earnings expectations will stabilise.
A falling share price can improve value. Falling forecasts can offset that improvement.
Know someone looking at McDonald’s because the yield has risen? Share this analysis so they can assess the operating risks alongside the dividend.
The $8.5 billion plan: what shareholders need to understand
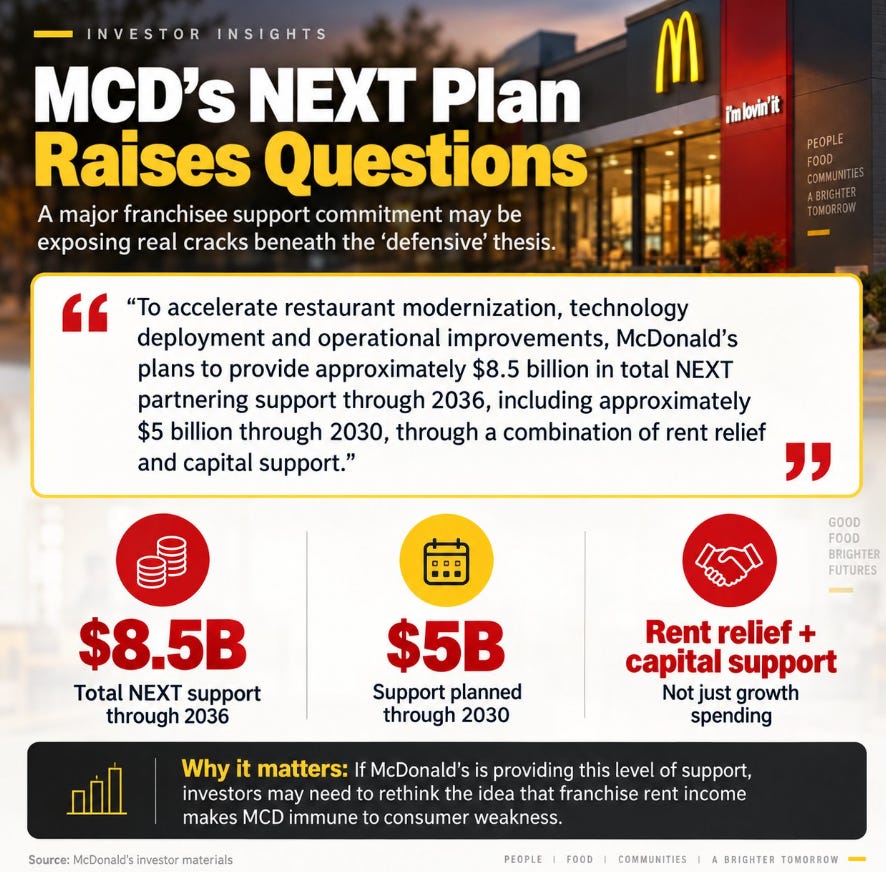
McDonald’s has outlined approximately $8.5 billion of NEXT partnering support through 2036, including approximately $5 billion through 2030. This combines rent relief and capital support for franchisees.

The time period matters. This is a multi-year commitment, and the full amount should not be treated as an immediate one-year cash expense.
The form of support matters too. Capital support and rent relief affect the business differently. Investors should assess the resulting revenue, spending and cash flow rather than subtracting the headline amount from one year’s earnings.
Management is targeting approximately 250 basis points of gross restaurant-level efficiency gains, equivalent to roughly $100,000 in annual cash-flow benefits for an average U.S. restaurant. It also targets corporate operating margins in the low-to-mid 50% range by 2030.
These are management objectives, not achieved results.
My interpretation is that McDonald’s is investing to protect and improve the economics of its restaurant system. If the improvements bring customers back and make restaurants more productive, shareholders can benefit from a healthier franchise base.
The risk is that the support arrives before the benefits and the benefits take longer, or prove smaller, than expected.
This is why the franchise model does not make McDonald’s immune to consumer weakness. Rent and royalties ultimately depend on a functioning, profitable restaurant network.
Expansion helps, but existing restaurants still need to improve
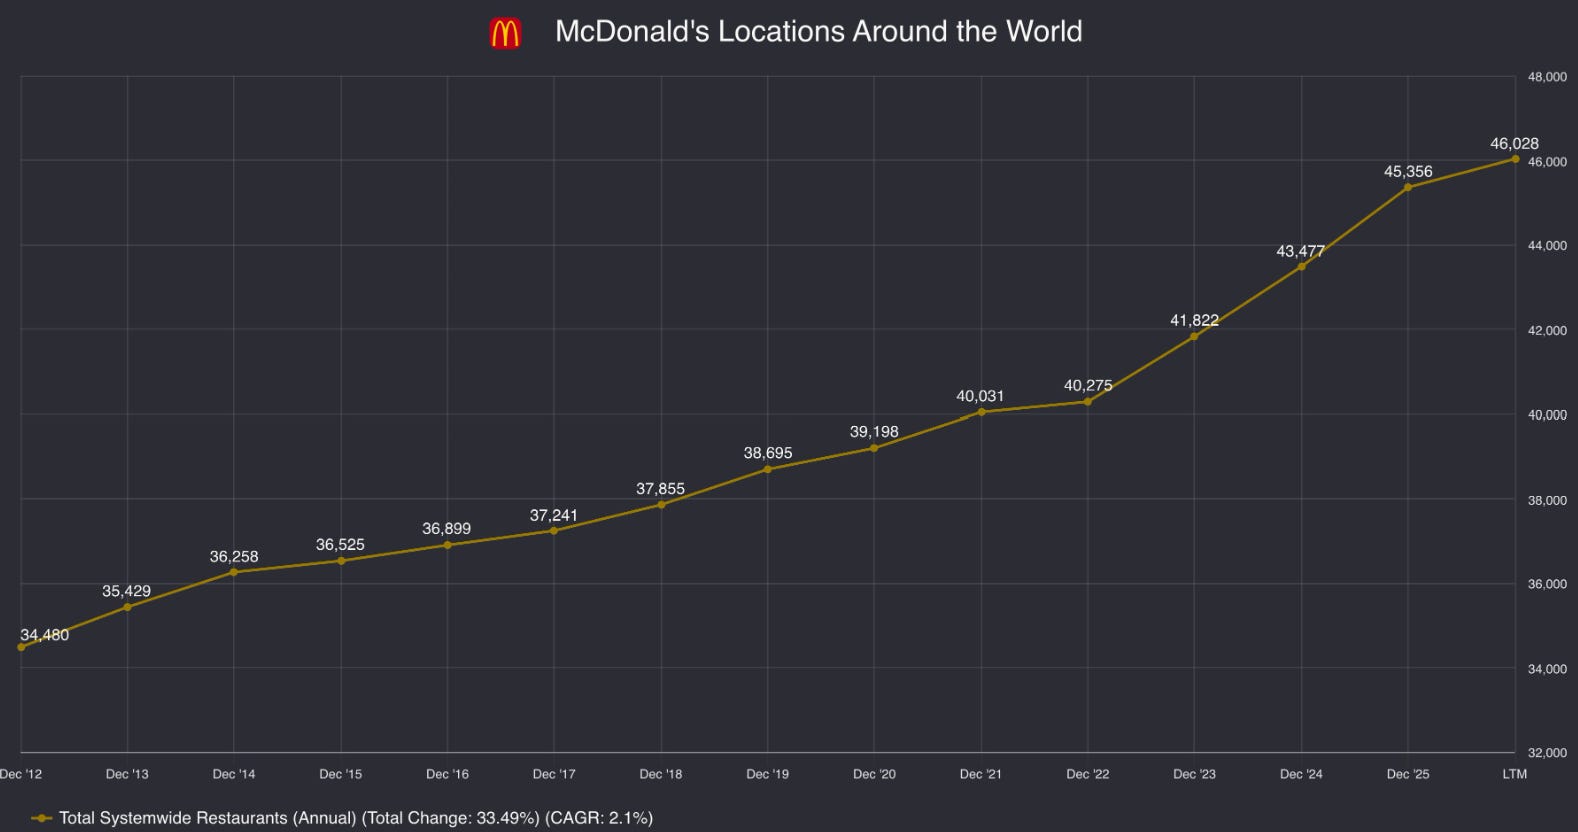
The global footprint has continued to expand. More locations can support systemwide growth even when sales at existing restaurants are sluggish.
But opening restaurants and improving existing restaurants are separate tests. I want expansion to add attractive returns, while the established network becomes more productive.
The company has scale, brand recognition and an enormous installed restaurant base. Those advantages give it tools to respond. They do not remove the need to execute.
Changing eating habits deserve attention
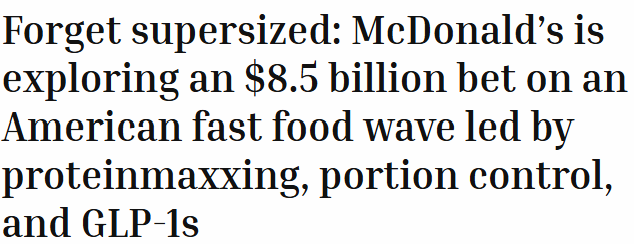
Changing preferences around protein, portion sizes and eating occasions create another challenge for the menu.
I would avoid treating the GLP-1 debate as proof that McDonald’s is permanently impaired. The reporting highlights both potential demand changes and the company’s efforts to adapt.
For shareholders, the useful questions are practical: will customers still visit, what will they order, and can those orders generate attractive restaurant profits?
New products only help the investment case if they translate into repeat demand and cash flow. Headlines about innovation are not enough.
The business still has considerable strengths
The selloff should not obscure the evidence of a durable business.
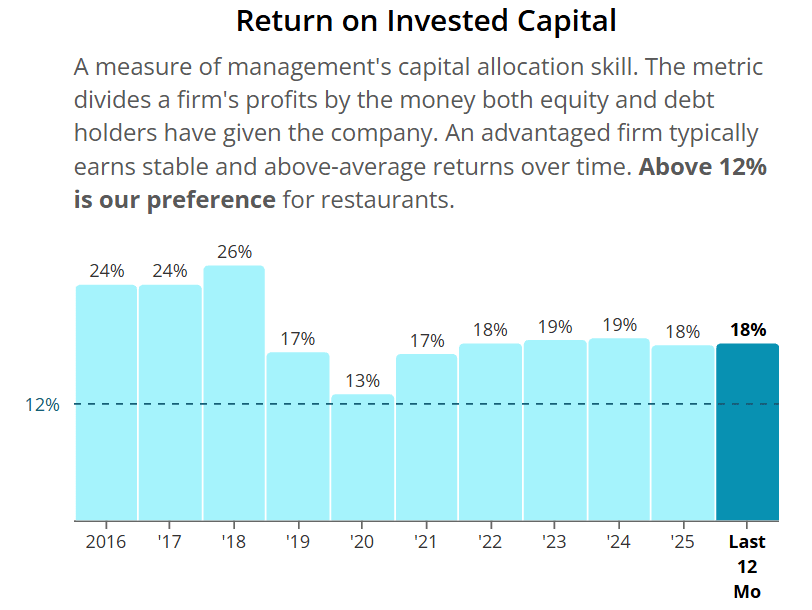
The return-on-invested-capital remains around 18%. That supports the view that McDonald’s can earn attractive returns on the capital deployed in the business.
The question is whether the next round of investment can preserve those economics. High past returns are useful evidence, but new spending must earn its place.
Shareholders have also benefited from a declining share count.
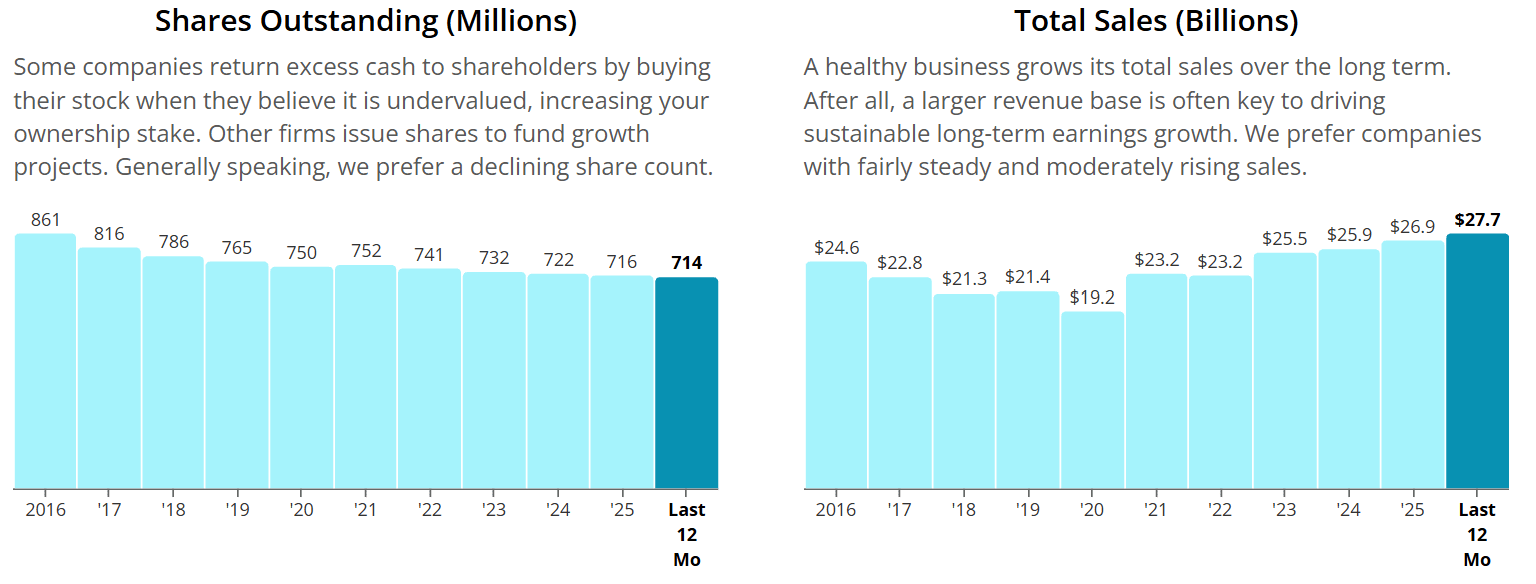
The chart shows shares outstanding falling by approximately 17% from 2016 to the latest trailing period.
That increases each remaining share’s claim on the business, all else equal. It can also help earnings per share grow faster than total earnings.
However, buybacks compete with other uses of cash. With franchise investment, dividends and debt obligations to consider, repurchases should remain disciplined.
I would rather see McDonald’s fund worthwhile investment than stretch its finances to maintain a buyback pace.
The dividend: a better starting yield, slower recent growth
McDonald’s declared a new quarterly dividend of $1.93 in September, equivalent to $7.72 annually. The increase marked its 50th consecutive year of dividend increases.
At the $231 price used in my valuation, that annualised payment implies a yield of approximately 3.34%.
That is a more appealing income starting point than investors received when the shares traded at a much higher valuation.
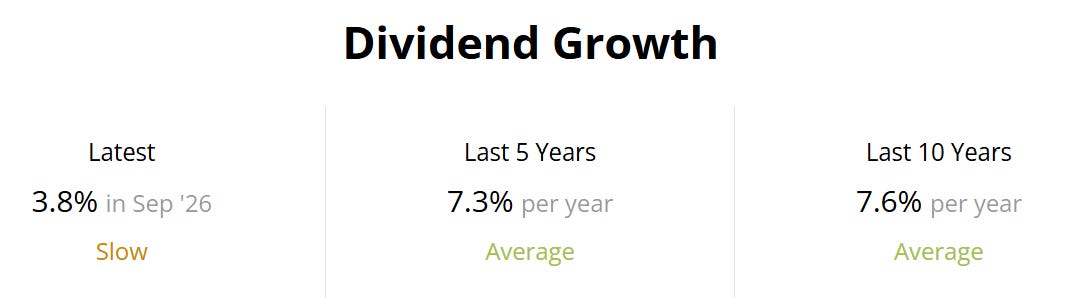
The latest increase was approximately 3.8% before rounding, below the five- and ten-year averages.
The long record is impressive. The recent pace is a reminder to separate dividend history from future dividend growth.
My income case does not require a return to 7%–8% dividend increases immediately. It does require the payment to remain supported by cash generation while the business reinvests.
Is the dividend covered?
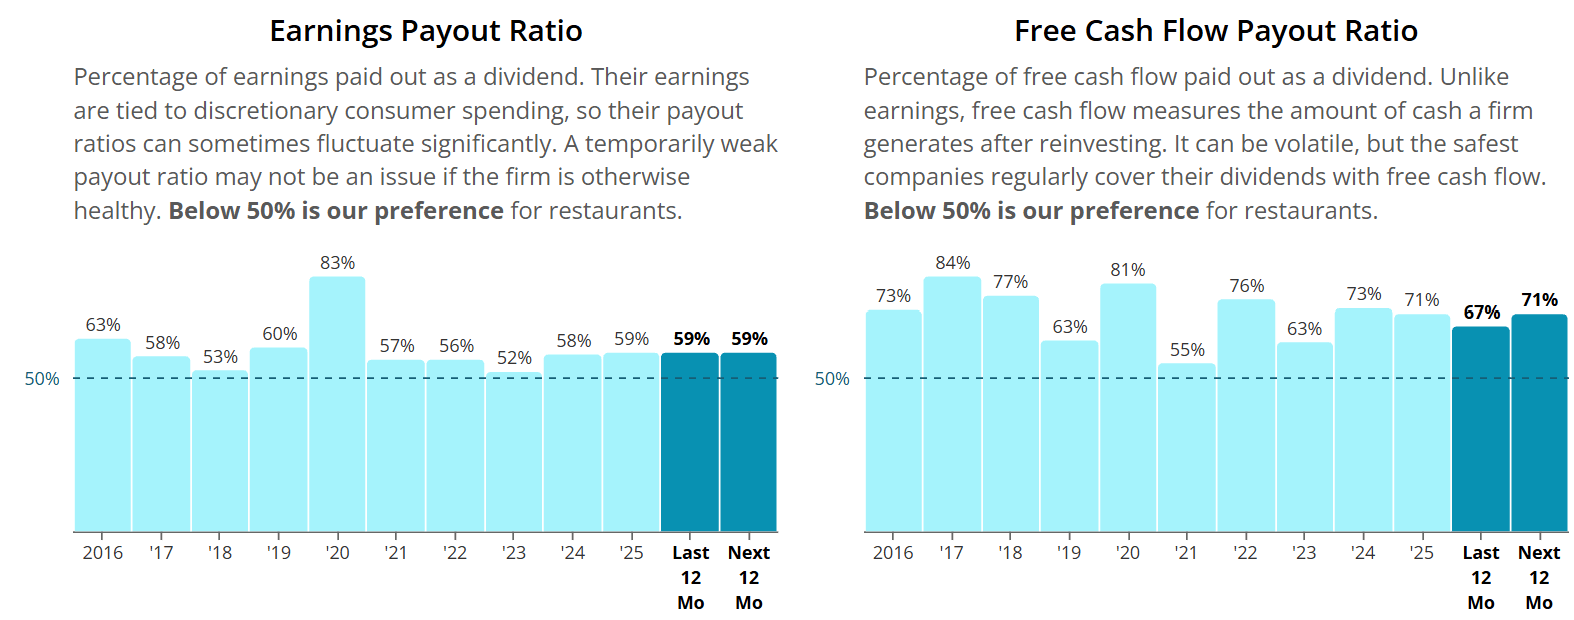
The estimates put the earnings payout ratio near 59%, with a trailing free-cash-flow payout ratio around 67% and a forward estimate around 71%.
That means the dividend is covered in these figures, but it uses a substantial portion of available cash.
A 71% payout leaves approximately 29% of free cash flow for other shareholder distributions and balance-sheet needs. Free cash flow is already calculated after capital expenditure, so ordinary capex should not be deducted a second time in that calculation.
The real issue is how future investment and rent support affect the cash flow available in subsequent years.
My reading: the data supports dividend coverage today, while leaving less room for disappointment than the company’s reputation might suggest.
The balance sheet also matters
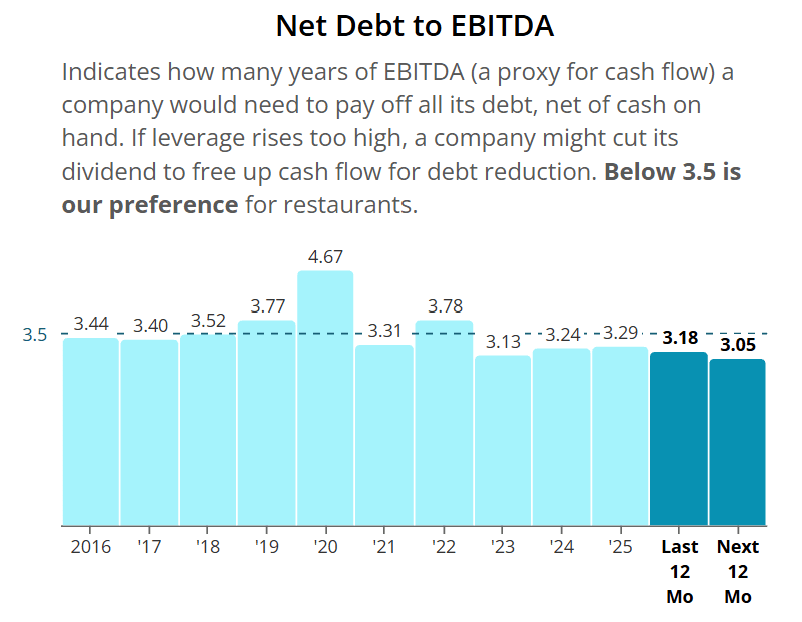
The leverage figures are below the more stressed levels shown earlier in the chart. That is encouraging.
But roughly three times net debt to EBITDA still represents meaningful leverage. I would assess it alongside debt costs, cash generation and the investment programme.
A dividend can be covered without every additional use of cash being equally comfortable. That is another reason to expect management to balance dividend growth, investment and buybacks carefully.
The cash-flow forecast is the bridge between quality and value
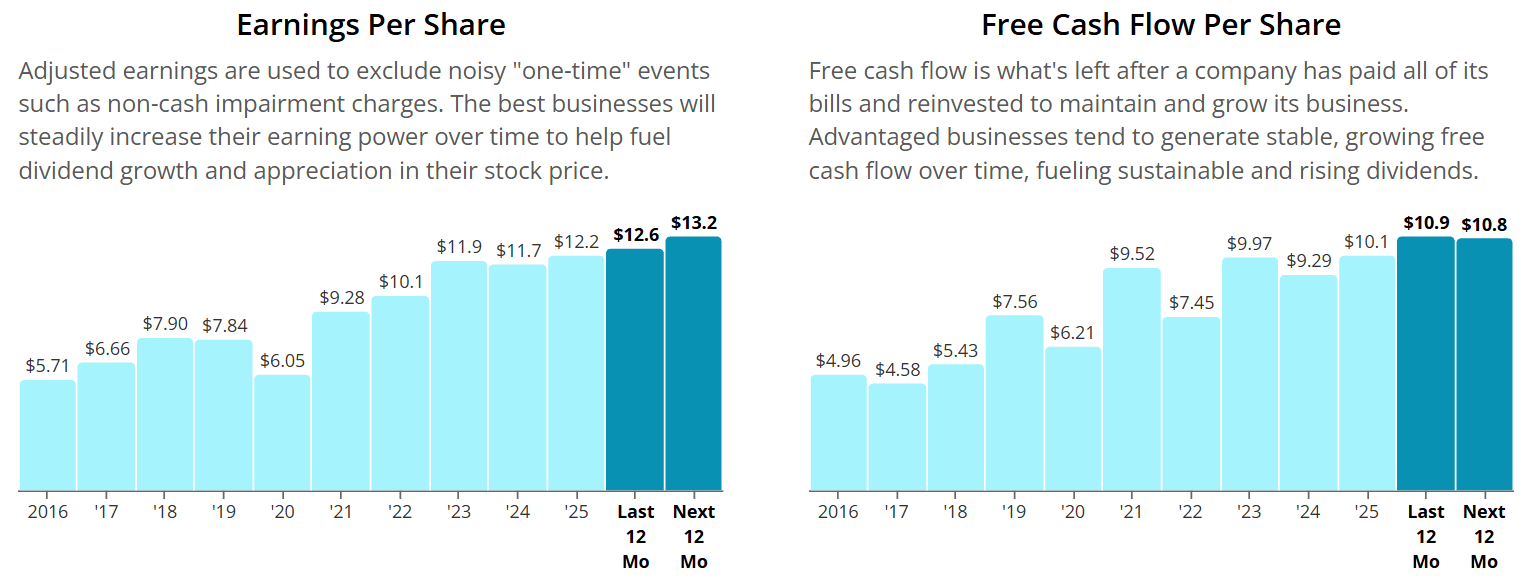
This chart contains an important caution.
Adjusted earnings per share are expected to rise from roughly $12.60 to $13.20, while free cash flow per share is estimated to edge down from roughly $10.90 to $10.80.
These are estimates from the research snapshot. The adjusted earnings series also differs from the trailing GAAP earnings shown in the earlier chart.
The takeaway is that earnings growth does not automatically produce immediate cash-flow growth. Investment, working capital and other factors can create a gap.
For a dividend investor, I want to see the cash-flow improvement eventually arrive. It is cash that supports the distribution and the company’s capacity to keep investing.
This is also why I compare stocks across valuation, business quality and risk. Paid members receive my Ranked Opportunity Dashboard, Fair Value Tracker and DCF research to help judge where opportunities like McDonald’s sit against other companies.
The McDonald’s valuation and my buy-price conclusion continue below, completely free.
What does the current valuation offer?
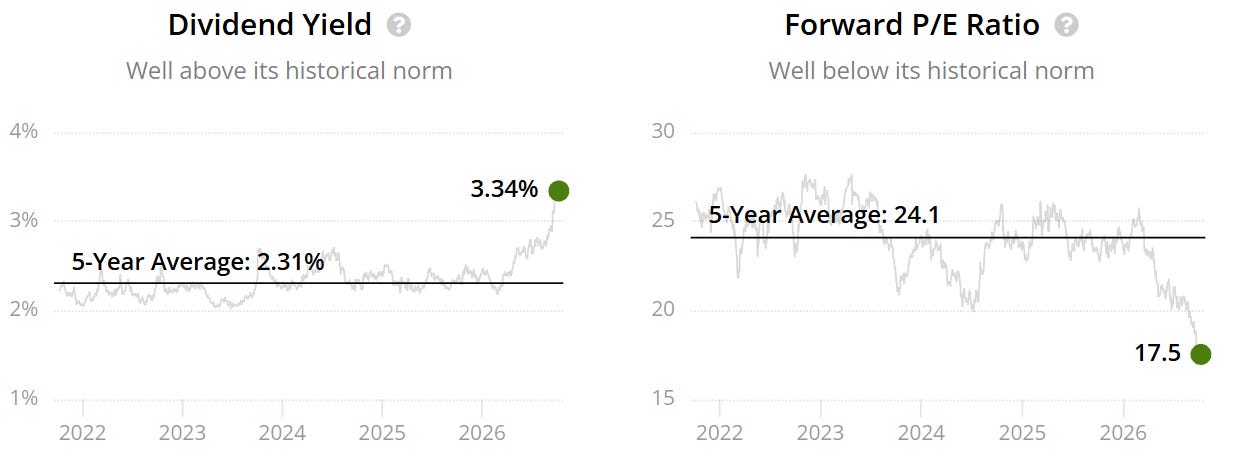
On these figures, the forward earnings multiple is approximately 27% below its five-year average. The dividend yield is substantially above its own historical average.
That is a meaningful change in the price investors pay for the business.
However, the historical average is a reference point, not a destination the market owes us. Slower growth, greater investment requirements or a higher required return could justify a lower multiple for longer.
The stock does not need to recover to 24× earnings to work. But a sensible investment case should remain credible without relying entirely on that recovery.
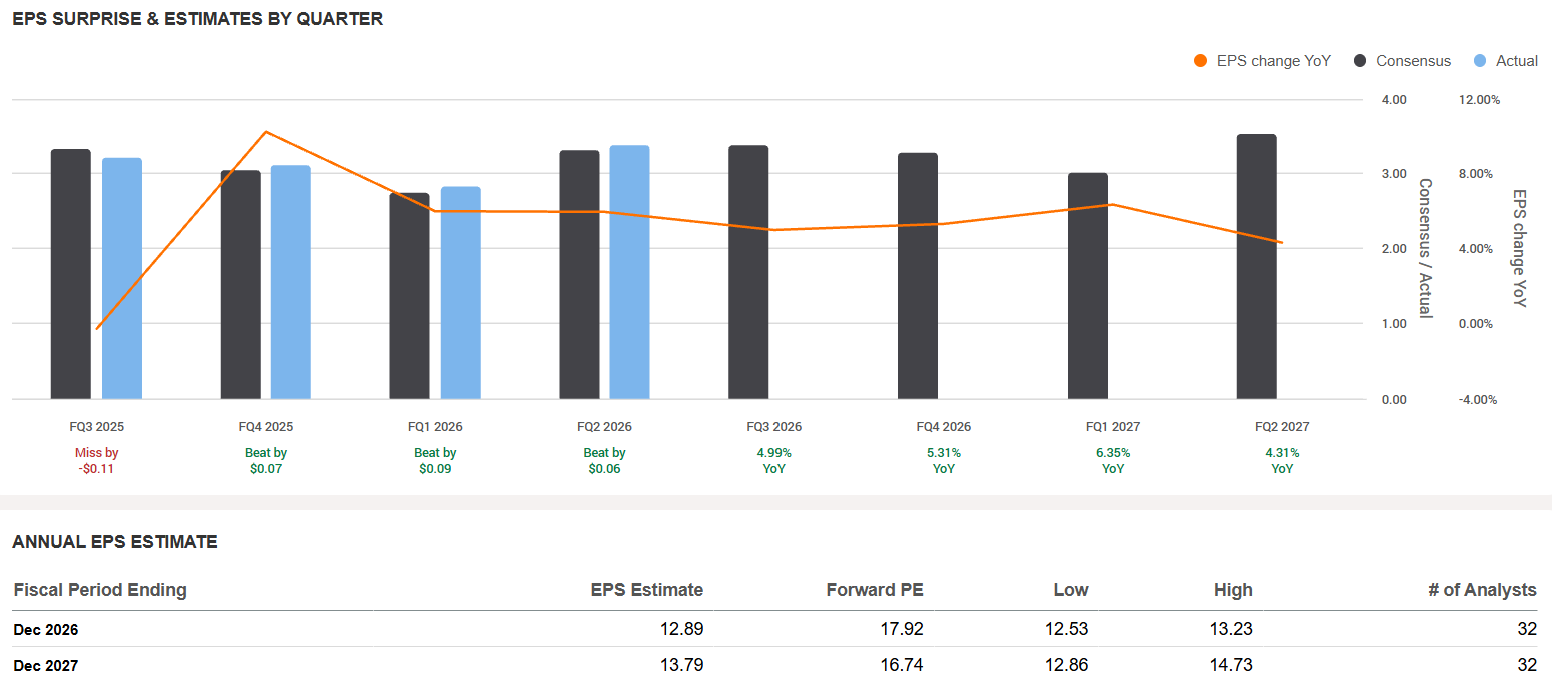
At $231, those estimates imply approximately 17.9× 2026 earnings and 16.8× 2027 earnings. The table’s slightly different displayed multiples reflect its own share-price snapshot.
Different services can also use different forward periods. A next-12-month P/E and a calendar-2027 P/E are not directly interchangeable.
As a rough illustration:
Applying 18× to the $13.79 estimate gives approximately $248.
Applying 20× gives approximately $276.
These are scenarios built on an earnings forecast, not promised future prices. If the forecast falls, the same multiple produces a lower value.
My DCF: $248.19, with important assumptions
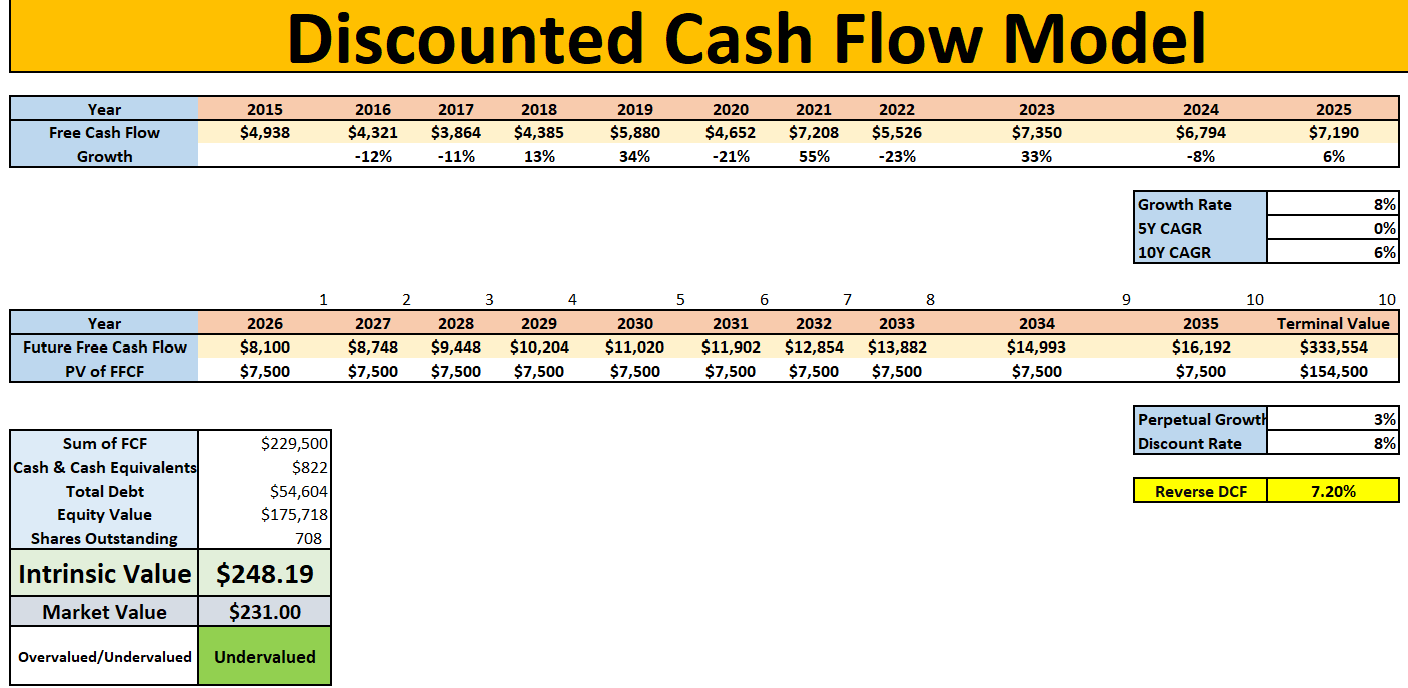
The model uses:
A first forecast-year cash-flow anchor of $8.1 billion.
8% annual growth after that first forecast year, over the remaining explicit forecast period.
An 8% discount rate.
3% perpetual growth.
The cash, debt and share-count adjustments shown in the spreadsheet.
Those inputs reproduce the model’s $248.19 per-share output.
Against $231, that represents approximately 7.4% price upside, or a 6.9% discount to the model value. Those percentages use different denominators; they are not interchangeable.
The 8% cash-flow growth assumption also deserves scrutiny. The model projects meaningful improvement over a decade, while the near-term cash-flow-per-share estimate shown above is relatively flat.
That is possible if investment and operating improvements deliver. It is an assumption to test, rather than something already established by recent results.
The reverse DCF shown in the sheet is approximately 7.2%. Under the same model structure, that is the growth assumption consistent with the $231 price.
Compared with the model’s 8% growth case, the difference is fairly small.
What if I demand a higher return?
Holding the displayed cash-flow forecast, terminal growth and balance-sheet adjustments unchanged, the model produces approximately:

This is sensitivity analysis of the model, not a separate forecast or an assertion that the shares will reach those prices.
It shows why I would not describe $248 as a universal fair value. A higher required return changes the conclusion substantially.
At a 10% discount rate, this particular model does not support a $231 purchase. An investor using that hurdle would need a lower price or a different, defensible cash-flow case.
Why my combined valuation is higher
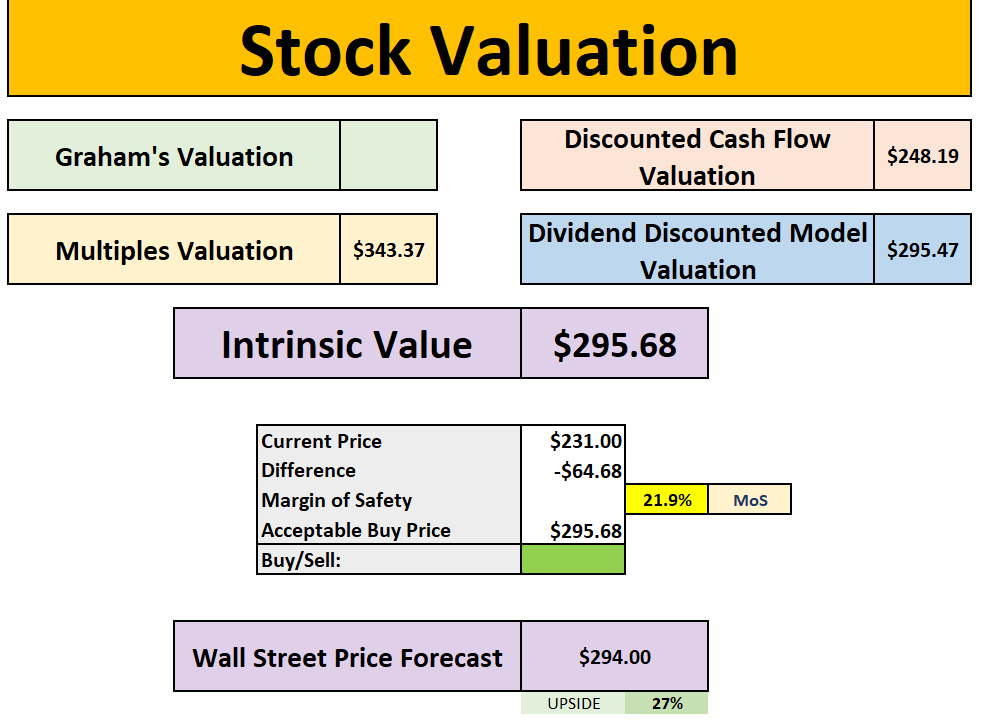
My summary contains three different valuation approaches:
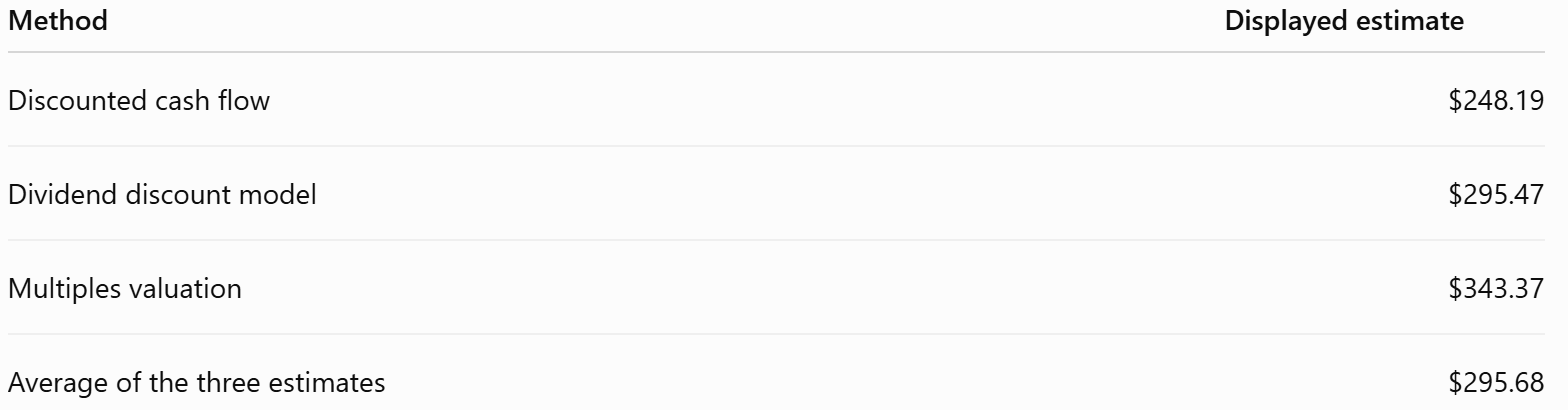
At $231, the average implies approximately 28% price upside and a 21.9% discount to that blended estimate.
The blend is useful for comparison, but it does not eliminate the uncertainty in its components. Each approach depends on assumptions about growth, required returns or the valuation investors will assign.
In particular, a higher multiple-based estimate should not overwhelm the more restrained cash-flow result.
For my entry decision, I would give greater weight to the lower cash-flow estimate and the operating risks than to the headline blended figure.
That is why I would not treat the spreadsheet’s $295.68 “acceptable buy price” field as a standalone instruction to buy anywhere below that price.
Wall Street sees upside - but the range is wide
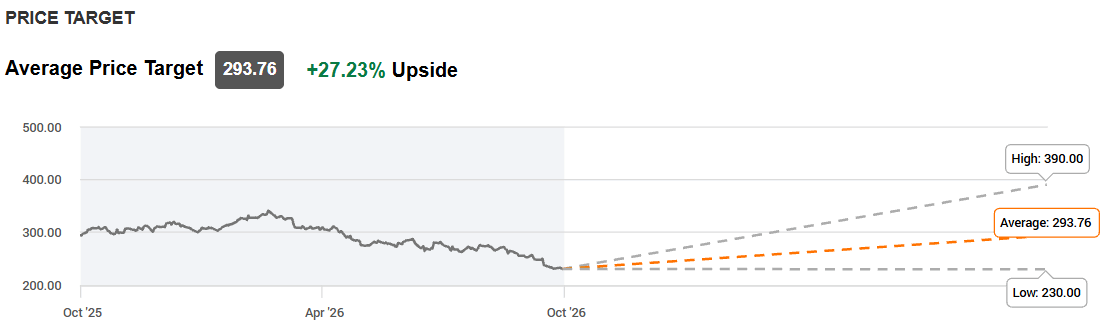
The analyst snapshot has an average target of approximately $294, broadly close to the blended valuation. The accompanying range runs from $230 to $390.
That spread is more useful than pretending the average is precise. It shows that analysts disagree substantially about the outcome.
Targets can also move as forecasts change, as the recent cuts demonstrate. I use them as context rather than as the foundation of the investment case.
My buy price - and what would change my mind
My preferred entry is around $225 or below.
That is a rounded decision threshold, rather than another model-derived fair value. It puts the price approximately 9% below the $248.19 displayed DCF output and implies a starting yield around 3.43% on the new annualised dividend.
It also corresponds to approximately 17.0× the $13.20 next-12-month adjusted EPS estimate, or 16.3× the $13.79 calendar-2027 estimate.
Neither earnings forecast is guaranteed. But that combination gives me a more attractive starting point for a business working through slower traffic and higher investment demands.
Here is how I would frame the levels:
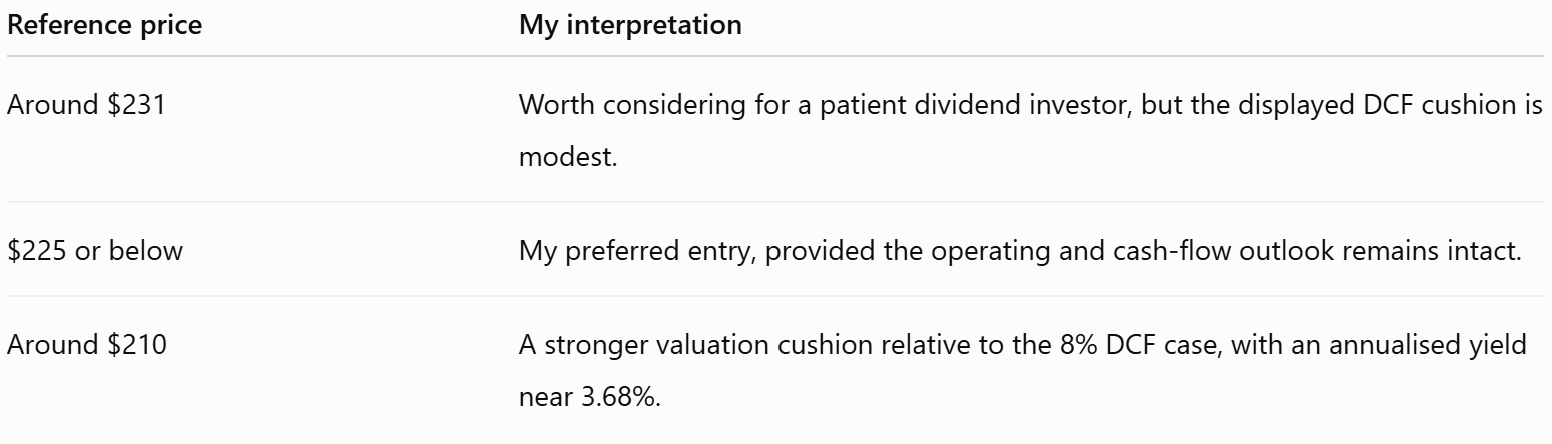
These levels follow the lower-return DCF case and the earnings/income cross-checks. They do not make the shares cheap under every discount-rate assumption.
I would also avoid treating a lower share price as automatically better news. If earnings and cash-flow expectations deteriorate meaningfully, I would reassess the valuation before adding.
The signals I would watch are:
U.S. customer traffic: are transactions stabilising, rather than sales growth depending mainly on spending per visit?
Franchise investment returns: are improvements producing better restaurant economics?
Cash flow: does it begin supporting the growth built into the longer-term model?
Capital allocation: can McDonald’s fund investment and the dividend while keeping leverage under control?
My conclusion is that McDonald’s has become more interesting after the selloff. The franchise model, profitability and dividend record remain meaningful strengths.
At the same time, the weaker traffic, slowing dividend growth and investment requirements give investors good reasons to demand a better entry price.
I see a credible long-term dividend opportunity, with $225 or below my preferred buy level. I would size an initial position cautiously and let operating progress determine whether the thesis deserves more capital.
Where McDonald’s fits in the wider opportunity set
This article gives you my complete McDonald’s analysis for free: the strengths, the risks, the valuation assumptions and the entry price.
The next question is whether it offers better value than the other companies competing for your investment capital.
That is what my paid research is designed to help you assess. Members receive the Ranked Opportunity Dashboard, Fair Value Tracker and DCF research, bringing valuation, business quality and risk together across a wider range of stocks.
If you want to compare McDonald’s with the other opportunities I’m tracking, become a paid member.
Prefer to stay free? Subscribe for future stock research and valuation analysis delivered to your inbox.
Would you consider McDonald’s around these prices, or do you need to see stronger customer traffic first?
Let me know in the comments.