
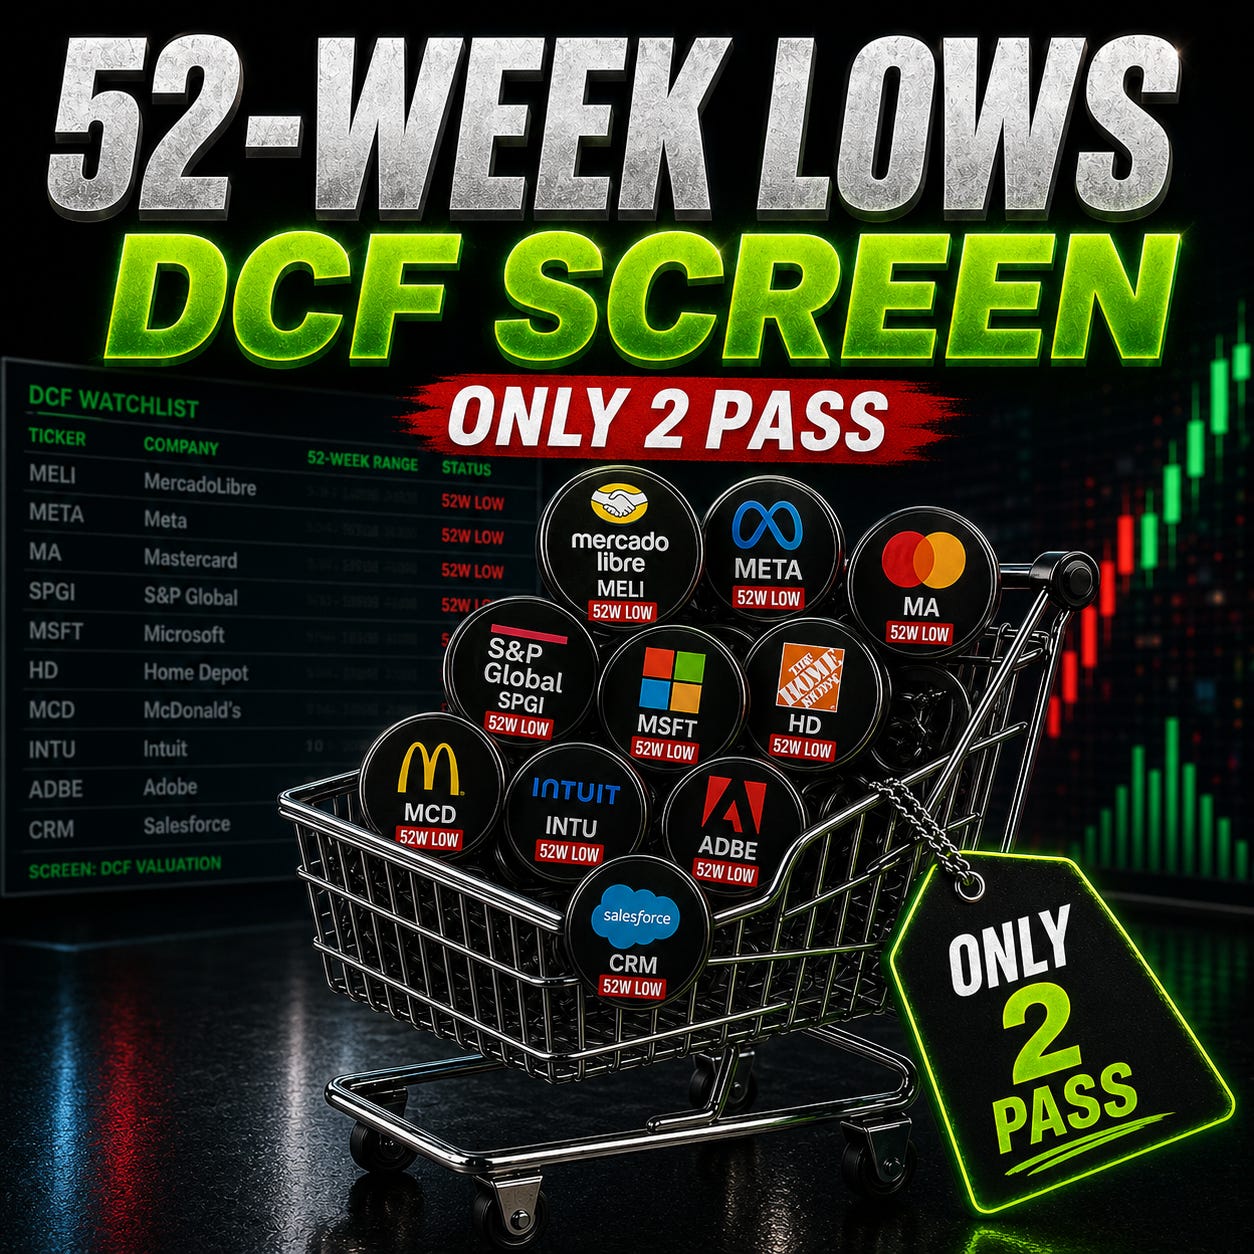
Most 52-Week Low Stocks Are Value Traps. My DCF Found Only 2 Buys
Cheap-looking stocks are showing up across the market again. After reworking the valuations, only two still looked like real buys.

A few weeks ago, the market looked like it was starting to move back into greed.
The major indexes had recovered. Investors were buying the dip again. And after a sharp rebound in some of the biggest names in the market, it started to feel like the panic phase had already passed.
But the latest sentiment data tells a slightly different story.
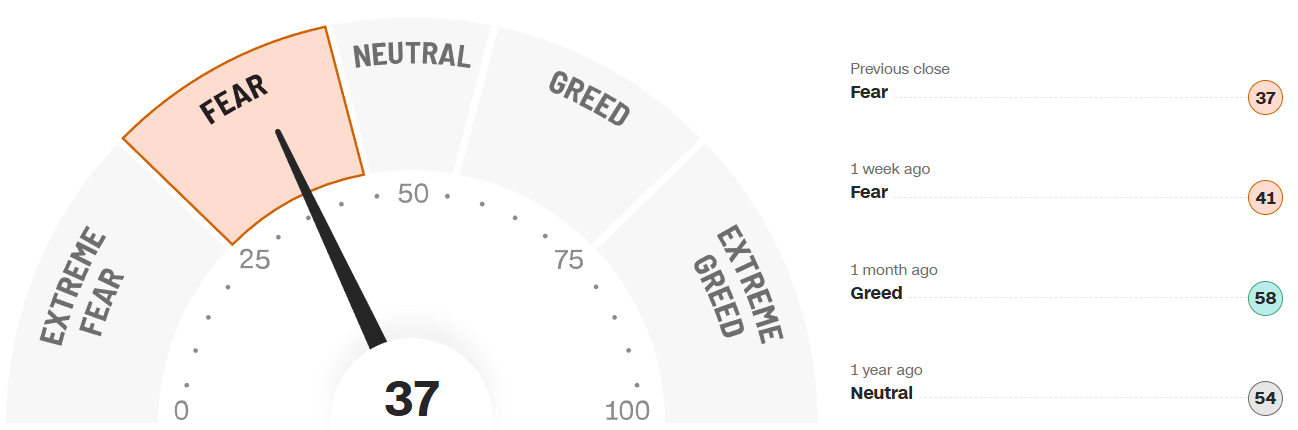
The Fear & Greed Index is now back in Fear, sitting at 37. That is only slightly below last week’s reading of 41, but it is a meaningful shift from one month ago, when sentiment was sitting in Greed at 58.
So the market has not completely broken.
But investors are clearly not as confident as they were a few weeks ago.
And when you look beneath the index level, the picture becomes even more interesting.
The S&P 500 June heatmap heatmap shows a market that is no longer moving together.
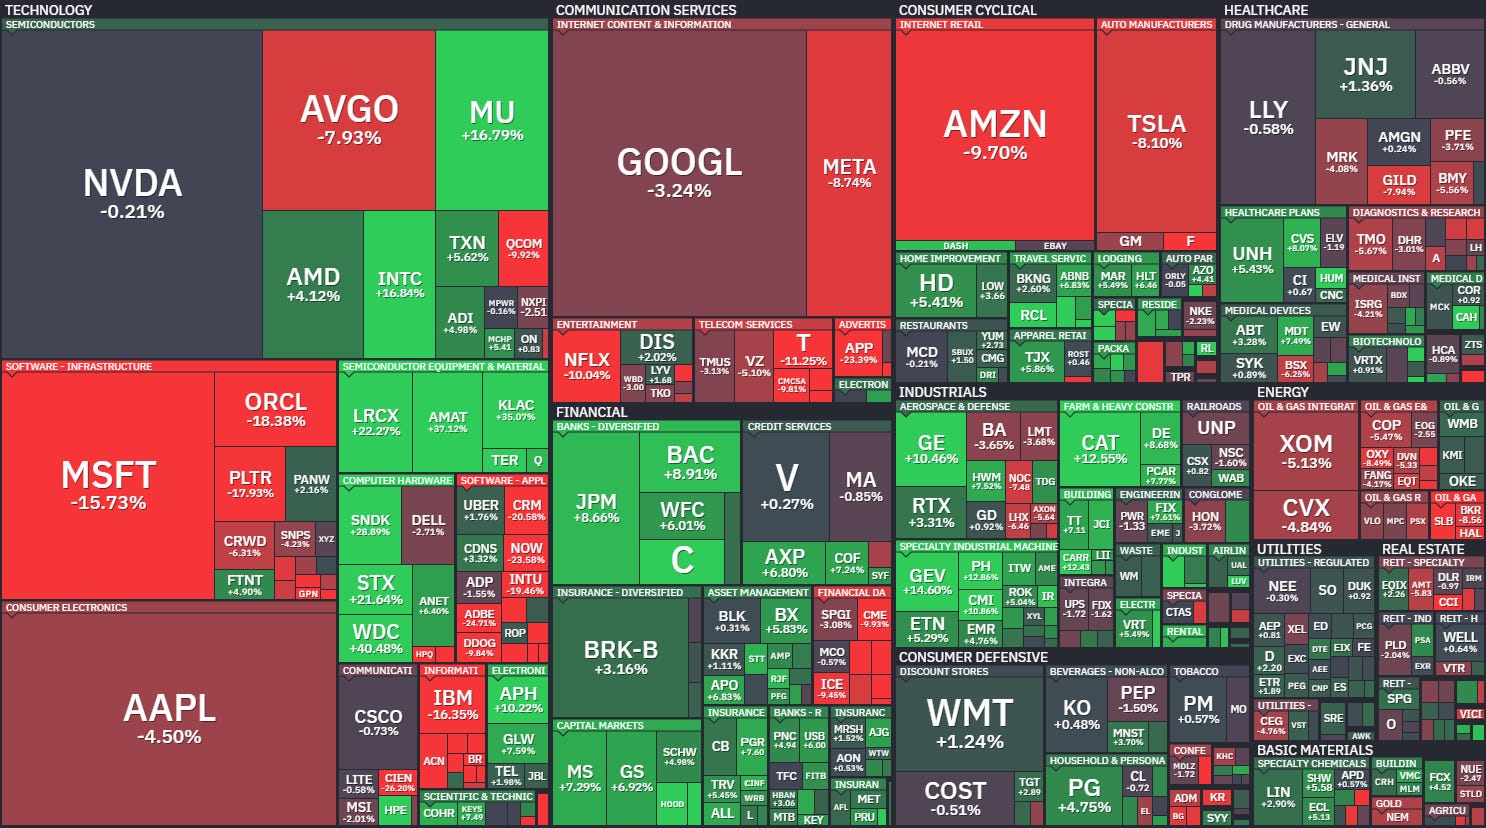
Some areas are still holding up well. Financials, industrials, parts of healthcare, and select semiconductor names have shown strength.
But many of the largest companies in the market are still under pressure.
Microsoft, Apple, Amazon, Tesla, Meta, Oracle, Broadcom, and several software names have all been hit hard this month.
That matters because headline indexes can hide a lot.
The market can look calm on the surface, while plenty of individual stocks are still going through serious drawdowns underneath.
And the S&P 500 drawdown from highs heatmap map makes that even clearer.
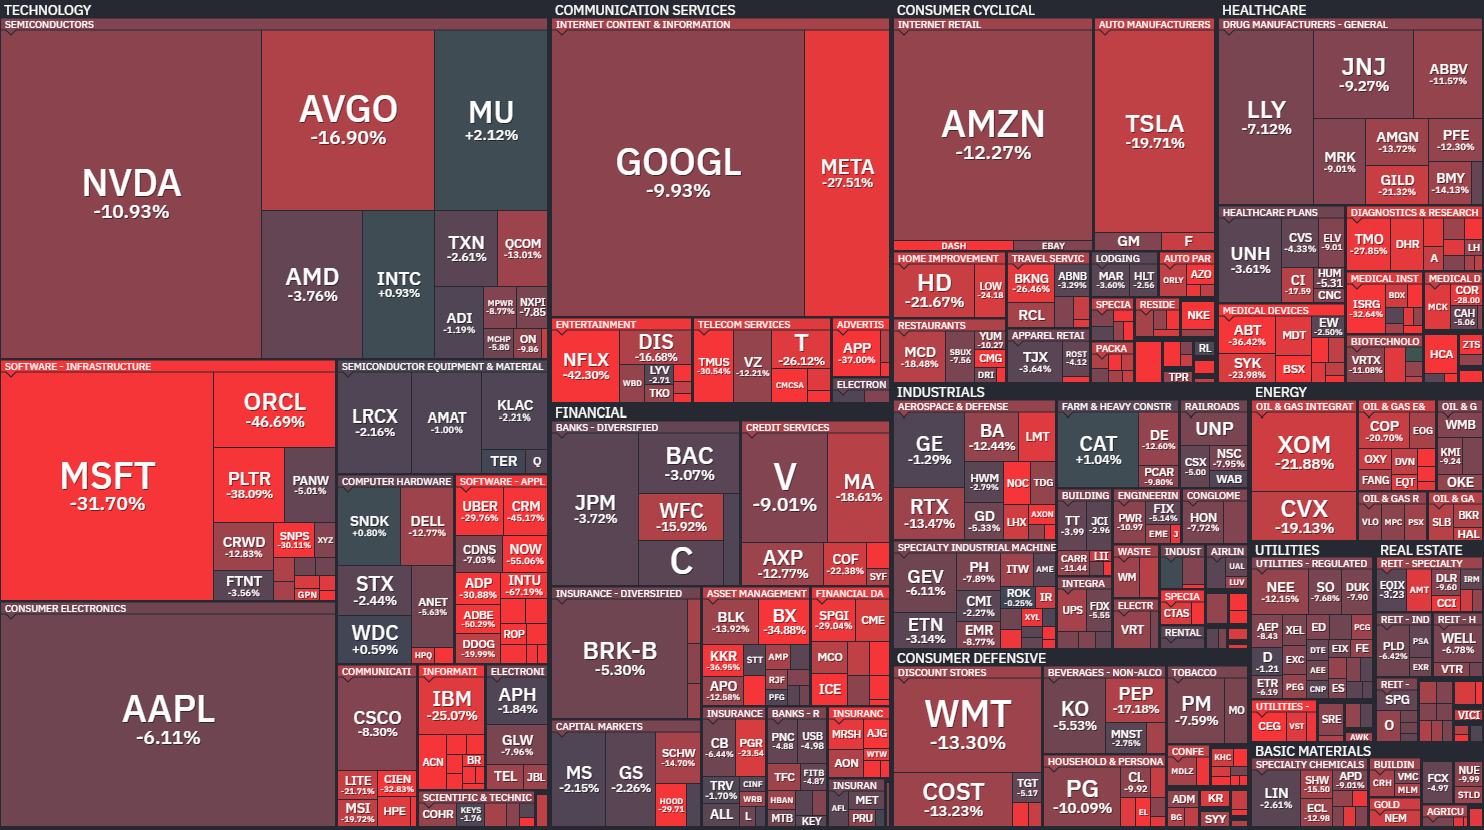
This is not just a small pullback in speculative names.
Some of the biggest companies in the market are still meaningfully below their highs.
Microsoft is down more than 30% from its peak. Meta is down more than 27%. Tesla is down nearly 20%. Amazon is down more than 12%. Oracle is down more than 40%. And several software names are still down 40%, 50%, or even more from their highs.
That creates opportunity.
But it also creates traps.
Because this is exactly the kind of market where investors can make two very different mistakes.
The first mistake is assuming every selloff is a buying opportunity.
The second mistake is assuming every weak stock is broken.
The truth is usually somewhere in between.
Some stocks are down because the market has become too pessimistic. Others are down because the business, the valuation, or the growth outlook has genuinely changed.
And that distinction matters even more now because the macro backdrop has become less forgiving.
The Federal Reserve is no longer giving investors the same easy path to lower rates.
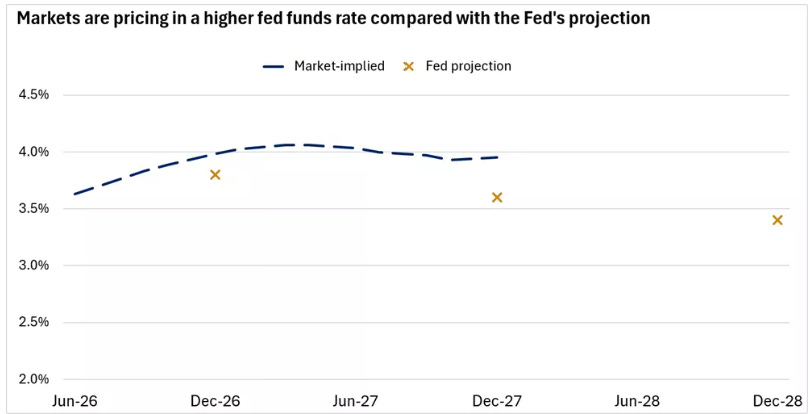
Last week the Fed held the fed funds target range steady at 3.5% to 3.75%, removed the previously projected 2026 rate cut from the dot plot, and shifted in a more hawkish direction as inflation remained above target. Markets are now pricing in a higher fed funds rate than the Fed’s own projections, which shows that investors are taking the higher-for-longer message seriously.
That is important because higher rates change the math for stocks.
When rates stay higher, future cash flows are worth less today. That makes valuation discipline more important, not less.
It also means the market is less likely to reward a stock just because it used to trade at a much higher price.
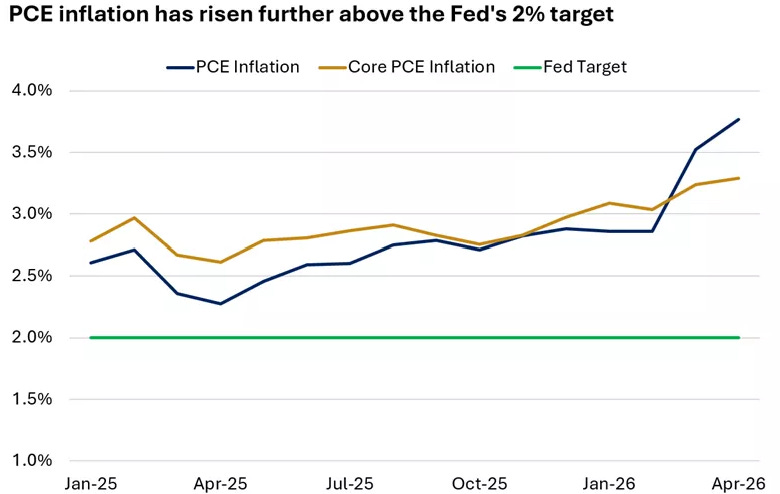
Inflation is another reason the market cannot fully relax yet.
Headline PCE inflation and core PCE inflation have both moved further above the Fed’s 2% target. The recent pickup has partly been driven by energy prices, but core inflation has also moved higher, which makes it harder for the Fed to justify cutting rates quickly.
That does not automatically mean another rate hike is coming.
But it does mean investors should probably not build their entire thesis around fast rate cuts.
And that matters for beaten-down stocks.
Because if rates stay higher for longer, then companies need to justify their valuations through actual earnings growth, cash flow, and execution - not just hopes of a lower discount rate.
There is also an interesting message coming from the fixed income market.
Short-term bonds now offer a wider yield advantage over cash. That reflects the market’s view that rates may stay elevated for longer, while also giving investors more options outside of equities.
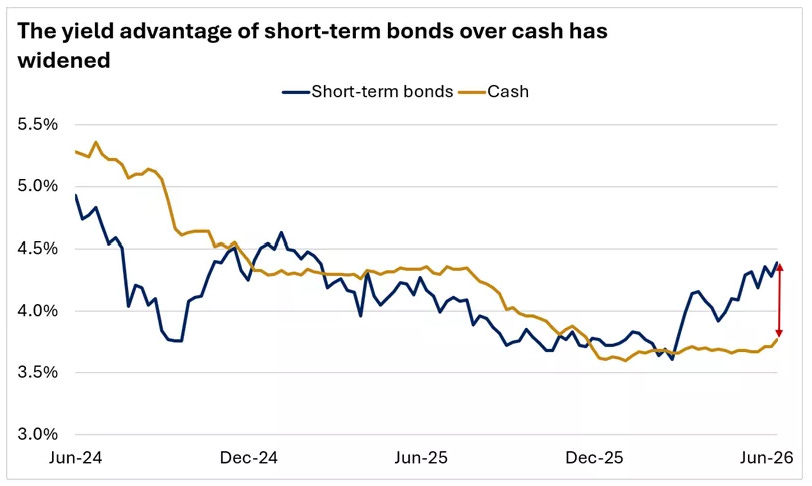
That is another reason the stock market has to work harder from here.
When investors can still earn a reasonable yield in short-term fixed income, they do not need to chase every stock that falls 20%, 30%, or 40%.
The opportunity has to be real.
The margin of safety has to be real.
And the valuation has to make sense.
That is why this week’s earnings calendar matters.
It is not the biggest earnings week of the year, but there are still important companies reporting, including FedEx, Micron, Paychex, Carnival, McCormick, Darden Restaurants, Jefferies, and others.

These reports will give investors a better read on demand, margins, consumer spending, business confidence, and whether companies can still guide positively in a higher-rate environment.
And that brings us to the real test.
A stock near a 52-week low can look very tempting.
The chart looks ugly.
The multiple may look lower.
Sentiment may already be washed out.
And the upside back to the old high can look huge.
But none of that automatically makes it a buy.
A lower price only matters if the business is still strong, the growth assumptions are still reasonable, and the valuation now leaves enough room for error.
So for this week’s screen, I wanted to go back to a very simple question:
Which beaten-down stocks are actually undervalued - and which ones are just cheap for a reason?
That is what this week’s DCF screen was designed to answer.
Now let’s get into the screen.
The key distinction here is simple.
A stock can be near a 52-week low and still not be cheap.
The price is down.
The chart looks ugly.
Sentiment is weak.
And the upside back to the old high can look huge.
But low prices alone do not create value.
In many cases, the market is not creating an opportunity. It is simply correcting for weaker growth, weaker margins, lower guidance, rising competition, or a business that no longer deserves the multiple investors once gave it.
That is where investors can get caught.
They see the drawdown.
They anchor to the old high.
And they mistake a lower price for a better opportunity.
But the old high is not what matters.
What matters is what the business is worth today based on the cash it can generate going forward.
That is why I did not want this screen to be driven by price action alone.
I re-ran the valuation work on a basket of stocks trading near 52-week lows, using a DCF-based framework to see which names still offered a real margin of safety - and which ones only looked cheap because the market had already priced in a weaker future.
Most did not make the cut.
Only two did.
The framework I used
There is no perfect way to value a stock.
A DCF is not a magic answer. Change the assumptions, and the output changes with them. But that is also why it is useful. It forces you to be explicit about what needs to happen for a stock to be worth buying.
For this screen, I focused on five questions.
1. Is the business still high quality?
If a company is near a 52-week low because the business itself is weakening, the lower price may not be an opportunity at all. It may just be the market catching up to a worse reality.
2. Are the growth assumptions still believable?
This is where a lot of cheap-looking stocks fall apart.
A stock can look optically inexpensive if investors are still anchoring to old expectations. But if the future growth path is now lower, the fair value is lower too.
3. Is the valuation leaving enough room for error?
Even if the business is solid, that does not automatically make the stock a buy.
The current price still has to leave enough room for a decent return without relying on perfect execution.
4. Is the downside understandable?
Some stocks are near 52-week lows because the market is overreacting.
Others are there because the risks are real.
So I wanted to understand what was actually driving the weakness. Was this mainly sentiment? A temporary slowdown? A margin reset? Or something more structural?
5. Would I still want to own it if the recovery takes time?
This matters more than people think.
A stock near a 52-week low does not have to bounce quickly to be a good investment. But if the thesis only works on the assumption of a fast rerating, it is probably not a very strong thesis.
At a high level, this was not a hunt for the most beaten-down stocks.
It was a hunt for the mispriced ones.
And once I put the list through that lens, the field narrowed quickly.
The first stock that looked interesting on the surface, but failed the full test, was Kimberly-Clark.
A stock that did not pass: Kimberly-Clark
Kimberly-Clark is exactly the kind of stock that can catch a dividend investor’s attention when it trades near a 52-week low.
The business is defensive.
The brands are familiar.
The dividend yield has moved much higher.
And the valuation looks much cheaper than usual.
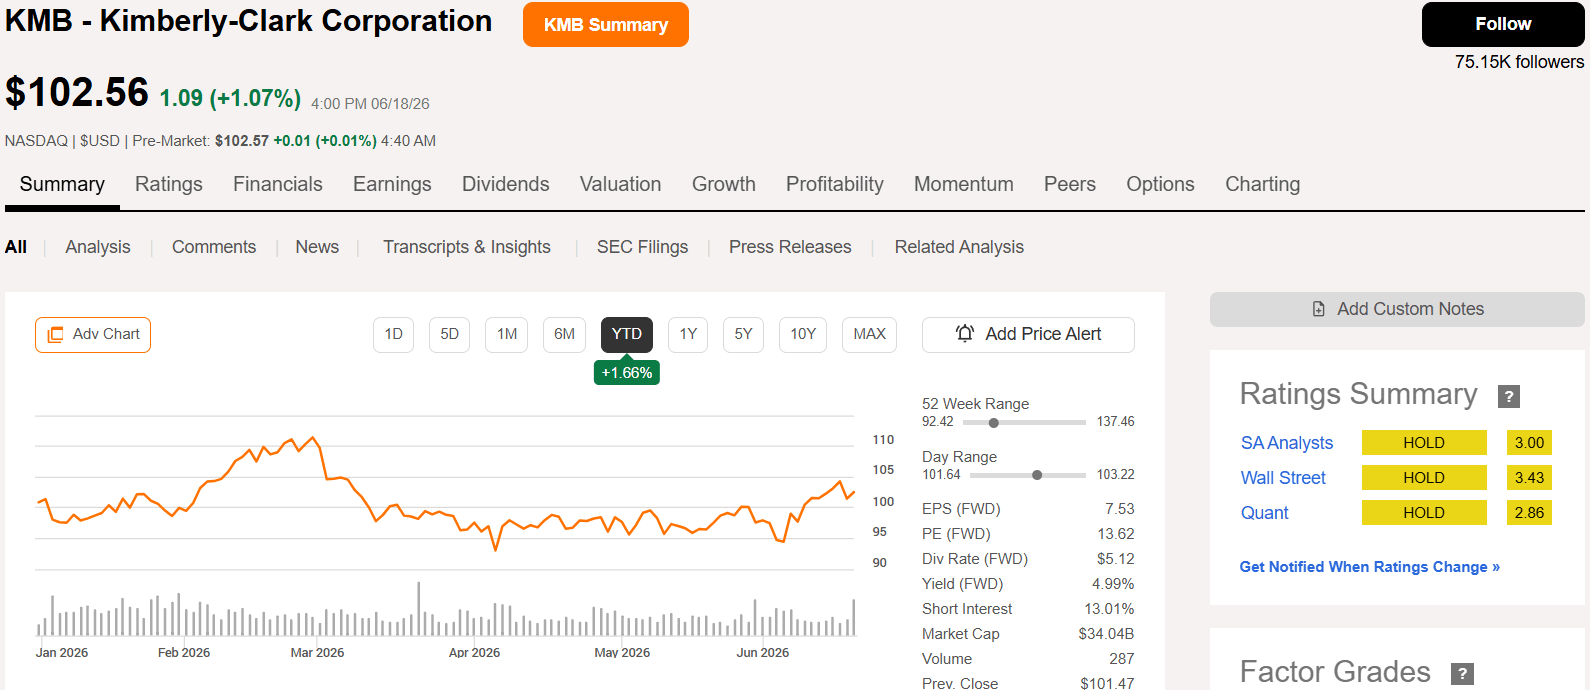
At the current price of around $102, Kimberly-Clark now yields close to 5%.
For a defensive consumer staples company, that immediately looks interesting.
Especially when the stock is also trading near the lower end of its 52-week range.
So on the surface, I completely understand why investors would stop and look at this one.
But this is also exactly why the screen matters.
Because a high dividend yield and a lower P/E ratio can make a stock look cheap before the underlying numbers actually confirm it.
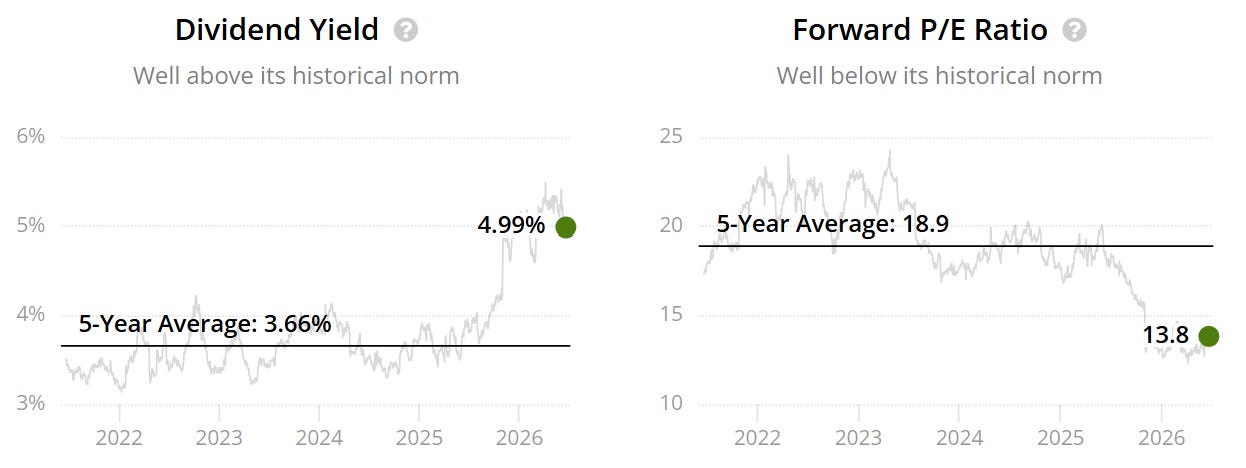
The historical valuation picture looks attractive at first.
Kimberly-Clark’s dividend yield is now around 5%, compared with a five-year average of 3.7%.
That is clearly well above its normal range.
The forward P/E also looks much cheaper than usual.
Kimberly-Clark is trading at roughly 14x forward earnings, compared with a five-year average of about 19x.
So if I only looked at the multiple and the dividend yield, the setup would look pretty simple.
Higher yield.
Lower multiple.
Defensive business.
Potential bargain.
But cheaper than normal is not the same thing as undervalued.
And the more I looked at the growth profile, the less convinced I became.
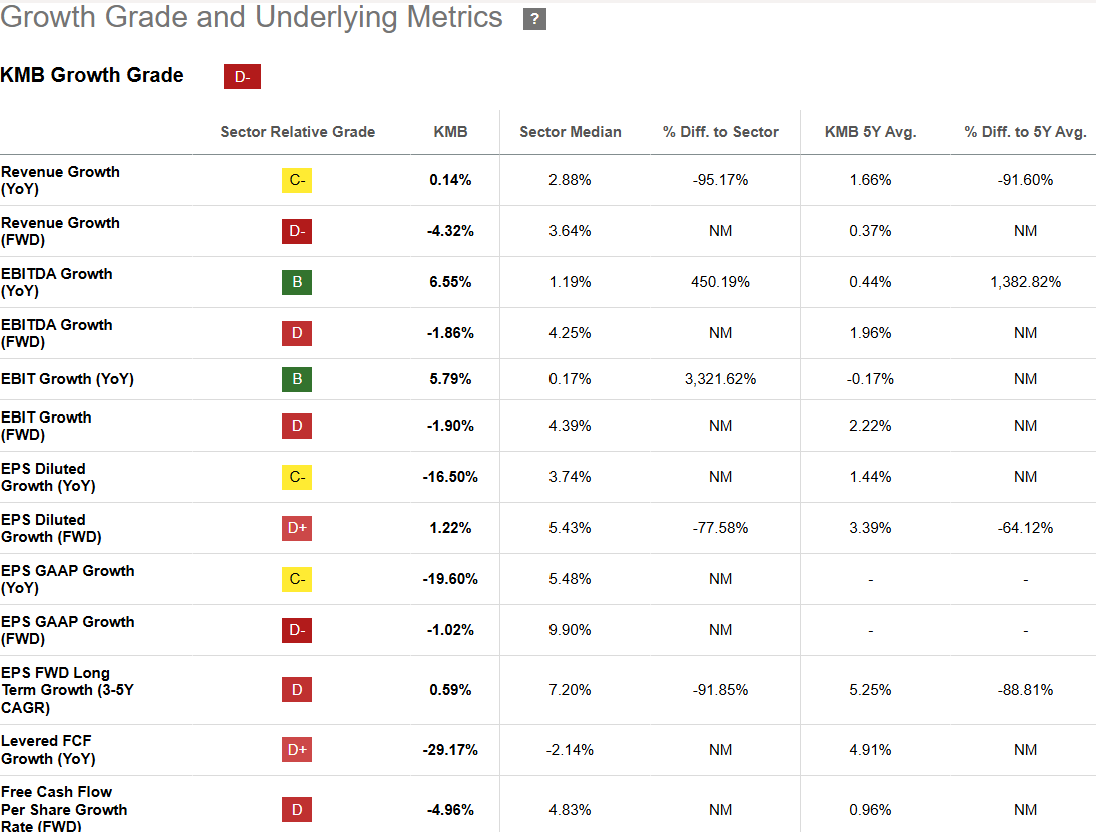
The problem is growth.
Kimberly-Clark has a weak growth profile right now, with a Seeking Alpha growth grade of D-.
Revenue growth is barely positive year over year, at just 0.14%.
Forward revenue growth is negative.
Forward EBITDA growth is negative.
Forward EBIT growth is negative.
And forward diluted EPS growth is only around 1.22%.
That matters because valuation compression is only attractive if the business still has enough future growth to justify a higher value.
A stock can deserve a lower multiple if the growth outlook is weaker.
And that is the key issue with Kimberly-Clark.
Yes, the yield is high.
Yes, the P/E is below its historical average.
But if future growth is weak, then the old average multiple may no longer be the right anchor.
That is why I wanted to see what the DCF said.
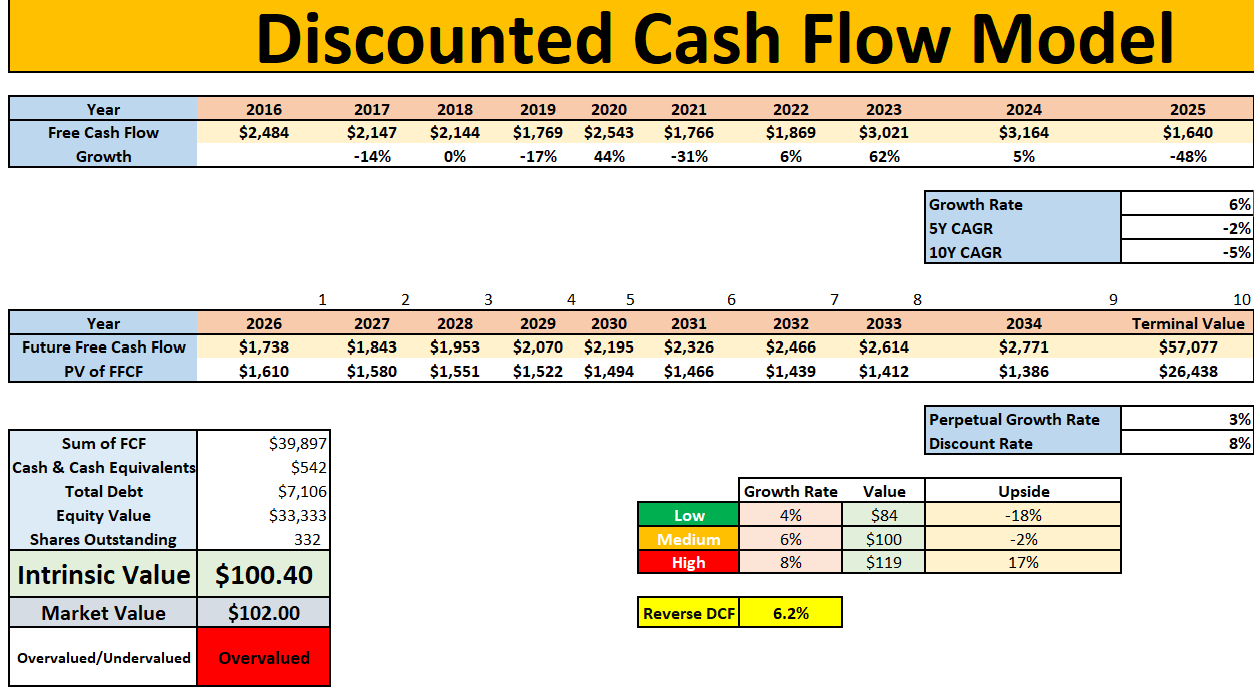
In my medium-case DCF, Kimberly-Clark came out with an intrinsic value of roughly $100.40 per share.
That compares with a current price of around $102.
So on the DCF alone, Kimberly-Clark actually looks slightly overvalued.
The low case gives a value of around $84.
The medium case gives a value of around $100.
And the high case gives a value of around $119.
So the stock can work if the business performs better than expected.
But the base case does not give me enough margin of safety.
That is the key point.
For this screen, I was not trying to find stocks that might be fine.
I was trying to find stocks where the valuation itself created a clear opportunity.
And Kimberly-Clark did not quite do that.
The reverse DCF also suggests the market is already pricing in around 6.2% future growth.
That does not look obviously conservative when the company’s recent and forward growth metrics are this weak.
So while the dividend yield makes the stock look attractive, the cash-flow valuation tells a more cautious story.
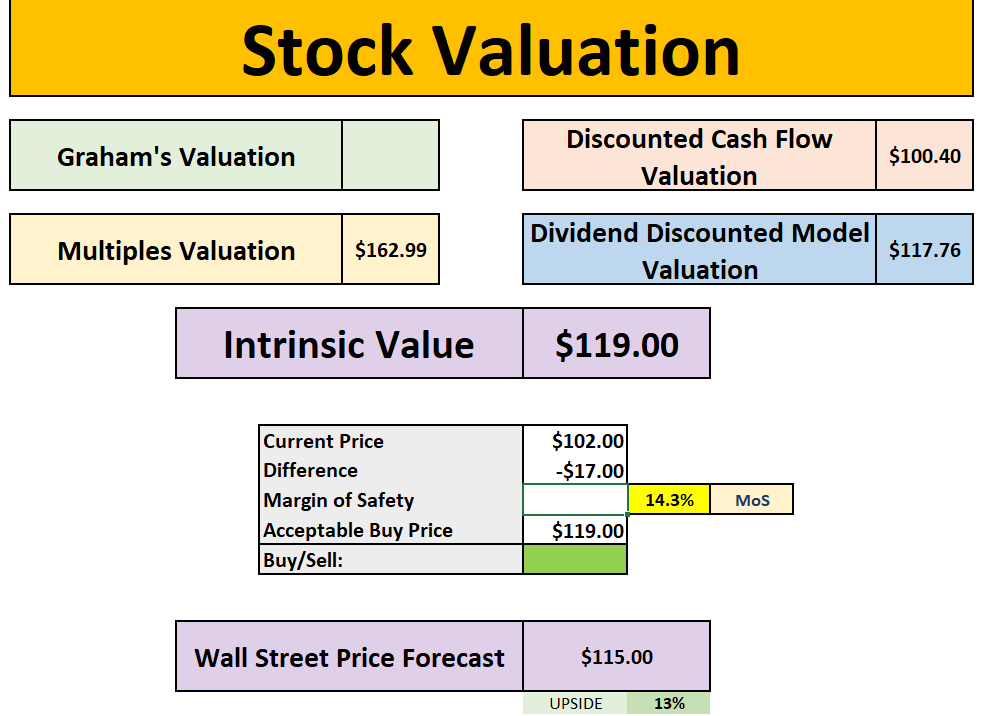
Now, to be fair, the broader valuation picture is not terrible.
My combined valuation model gives Kimberly-Clark an intrinsic value of around $119 per share.
That compares with a current price around $102, implying a margin of safety of about 14.3%.
The dividend discount model also gives a value around $117.76.
And Wall Street’s average price target is around $115, implying roughly 12% to 13% upside.
So I would not call Kimberly-Clark wildly expensive.
This is not a stock where the numbers are screaming danger.
But it also is not a stock where the numbers are screaming opportunity.
And that is why it did not make the cut.
The business is defensive.
The dividend yield is attractive.
The P/E ratio is below its historical average.
And there is some upside in the broader valuation model.
But the DCF does not support enough upside, the growth grade is weak, and the margin of safety is not large enough for me to put it in the final two.
So Kimberly-Clark is a good example of the kind of stock this screen is designed to filter out.
It looks cheap at first glance.
It may still be reasonable for income-focused investors.
But for this specific screen, where I am looking for the strongest opportunities near 52-week lows, Kimberly-Clark did not pass.
A second stock that did not pass: Nike
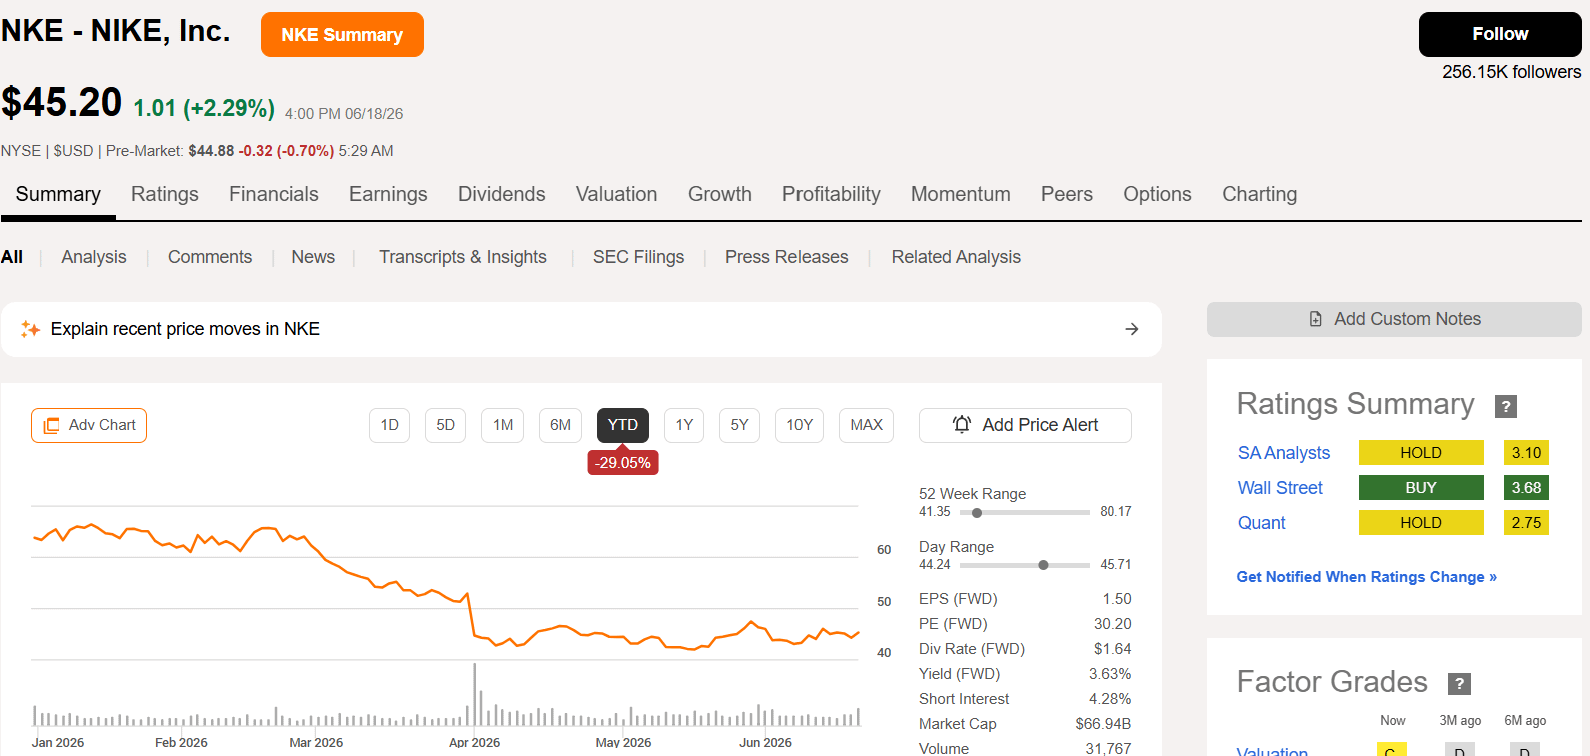
The second stock that looked tempting, but still did not pass the full screen, was Nike.
And I completely understand why investors are looking at this one.
Nike is one of the most recognisable brands in the world. The stock has been hit hard. It is down around 29% year to date, trading near the bottom end of its 52-week range, and sentiment has clearly reset.
At around $45 per share, this is no longer the premium-priced Nike that investors were looking at a few years ago.
The problem is that a lower price does not automatically mean the risk/reward is attractive.
And with Nike, the issue is not just valuation.
The issue is that the business still needs to prove the recovery is real.
On the surface, Nike does look much cheaper than usual.
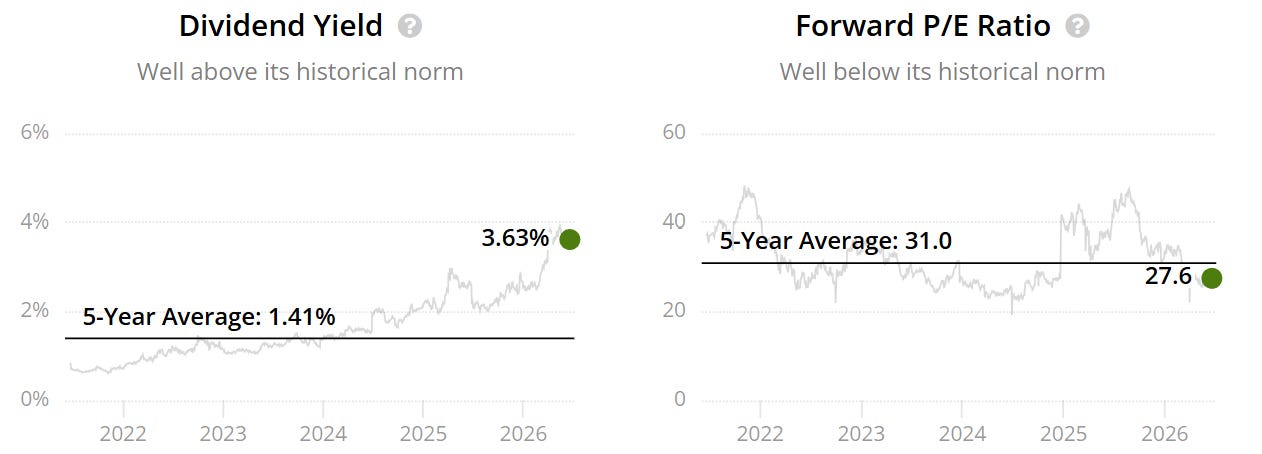
The dividend yield is now around 3.6%, which is far above its five-year average of 1.4%.
The forward P/E is also below its historical norm, sitting around 28x compared with a five-year average of 31x.
So the stock is clearly cheaper than it used to be.
But this is where the screen becomes important again.
Nike is cheaper than normal, but it is not obviously cheap in absolute terms.
A forward P/E in the high 20s still requires investors to believe that the company can return to healthier growth over time.
And right now, the growth data does not fully support that confidence.
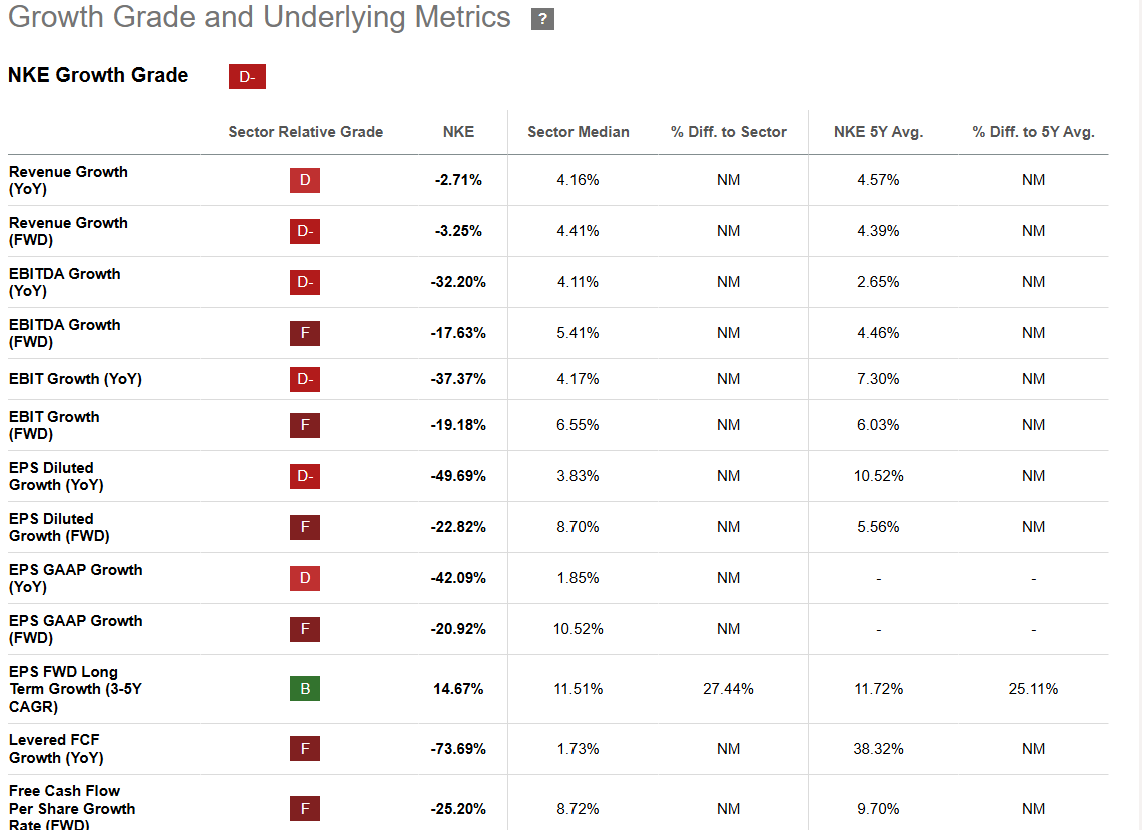
Nike’s growth grade is currently D-.
Revenue growth is negative year over year.
Forward revenue growth is negative.
EBITDA growth is deeply negative.
Forward EBITDA growth is also negative.
EBIT growth is down sharply.
Forward EBIT growth is negative.
And diluted EPS growth is down almost 50% year over year, with forward EPS growth also expected to remain negative.
That is the issue.
Nike is not just a stock that has fallen because investors got nervous.
The fundamentals are under pressure too.
And when a company still trades at a fairly rich multiple while growth is negative, the valuation has to be treated very carefully.
This does not mean Nike is broken forever.
But it does mean the stock needs a genuine turnaround to justify stronger upside.
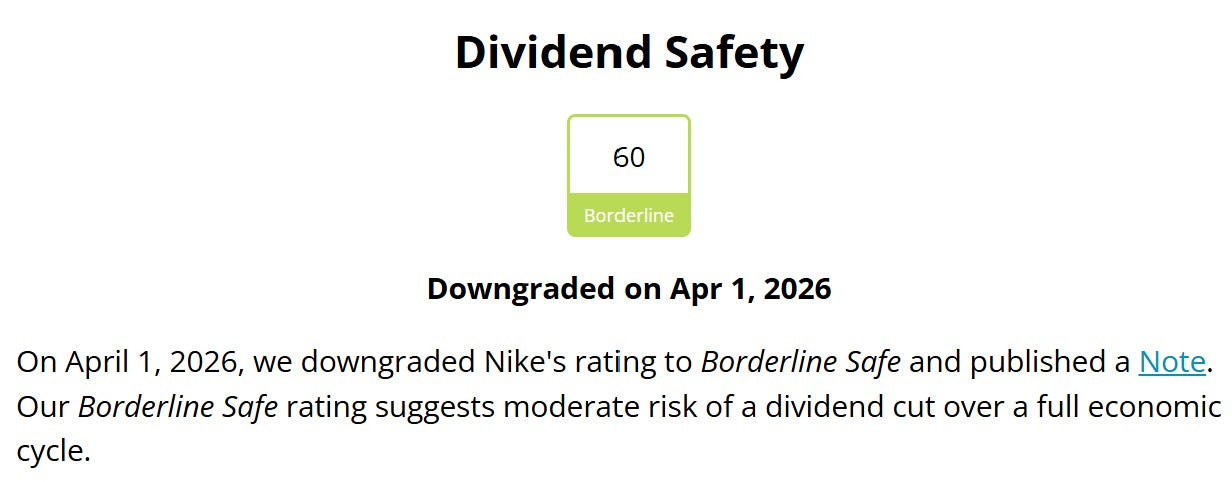
The dividend picture also needs some caution.
Nike’s dividend safety score is currently 60, which is classified as Borderline.
That does not mean a dividend cut is guaranteed.
But it does suggest the dividend is no longer as safe as investors may have assumed in the past.
And that matters because one of the things making Nike look more attractive today is the higher dividend yield.
If the dividend yield is rising because the stock price is falling while earnings and cash flow are under pressure, then investors need to be careful about treating that yield as a clean buy signal.
For a dividend investor, this is not just a cheap brand story.
It is a turnaround story with execution risk.
That is also what showed up in my DCF.
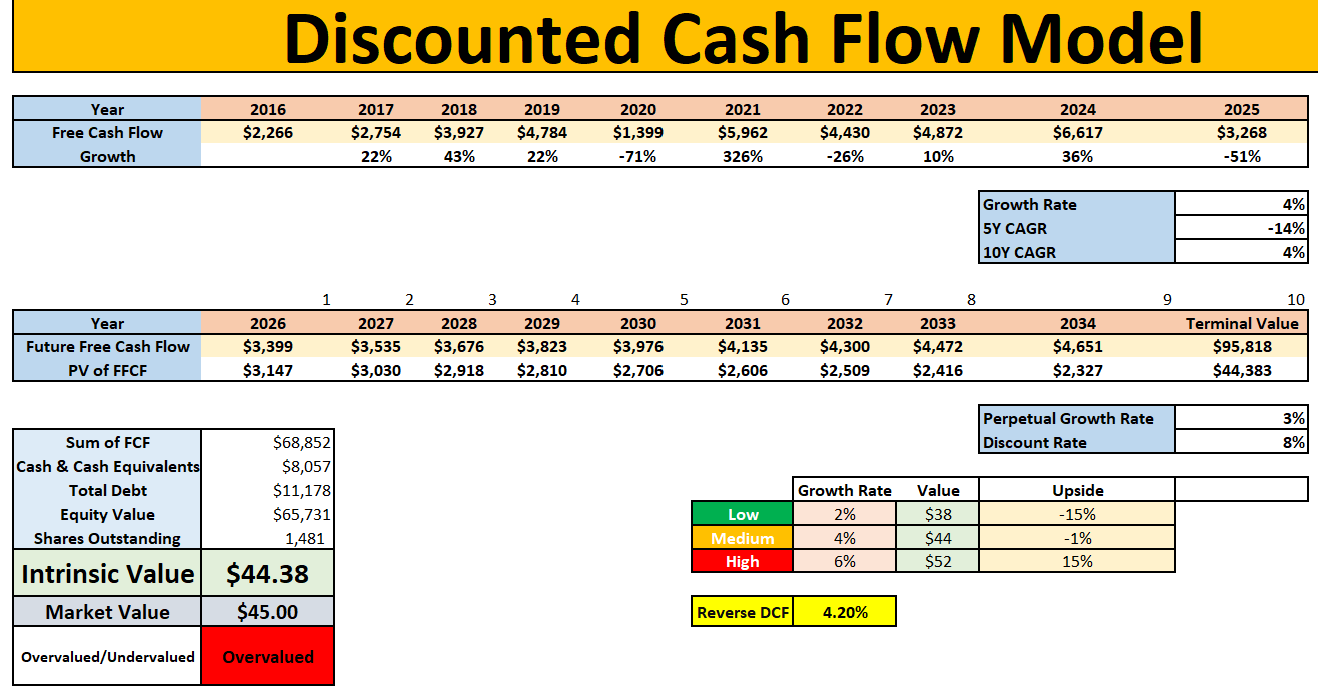
In my medium-case DCF, Nike came out with an intrinsic value of roughly $44.38 per share.
That compares with a current price around $45.
So on my base-case numbers, Nike looks slightly overvalued.
The low case gives a value of around $38.
The medium case gives a value of around $44.
And the high case gives a value of around $52.
So yes, there is upside if Nike can execute better than expected.
But the base case does not give enough margin of safety.
And for this screen, that was the key problem.
The goal was not to find stocks where the upside might work if the turnaround goes well.
The goal was to find stocks where the current valuation already looked attractive under reasonable assumptions.
Nike did not clear that bar.
The reverse DCF also implies around 4.2% future growth.
That might not sound aggressive, but when revenue growth, EBIT growth, EPS growth, and free cash flow growth are all under pressure, I do not think the market is giving investors a huge margin of safety here.
Now, this is where Nike gets interesting.
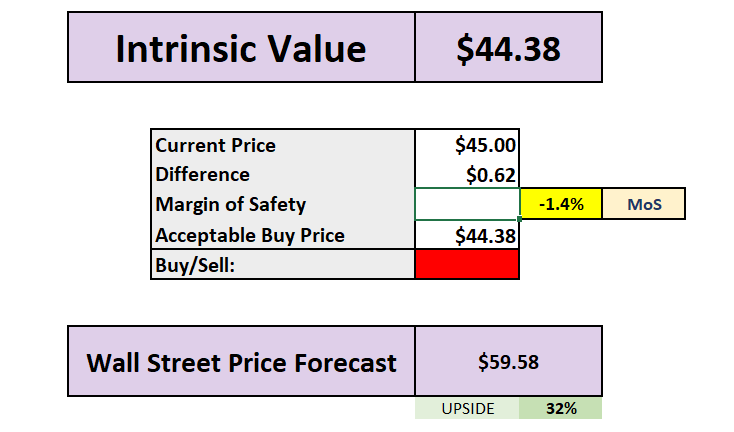
Wall Street’s average price forecast is around $59.58, implying roughly 32% upside from the current price.
So analysts clearly see a recovery path.
And I understand that case.
Nike still has a powerful brand, global scale, direct-to-consumer potential, and room to improve margins if the business stabilises.
But the problem is that my valuation work does not support that same level of confidence yet.
My intrinsic value estimate came out at roughly $44.38.
Against a current price around $45, that leaves a negative margin of safety of about 1.4%.
So while Wall Street sees meaningful upside, my DCF says the stock is much closer to fair value.
And that is why Nike did not make the cut.
This is not a stock I would completely dismiss.
If the turnaround works, Nike could absolutely recover.
But as of today, the numbers still look too uncertain for me to call it one of the best opportunities near 52-week lows.
The stock is down a lot.
The brand is still strong.
The dividend yield is much higher than normal.
And Wall Street sees upside.
But the growth profile is weak, the dividend safety score has been downgraded, and the DCF does not show enough margin of safety.
So Nike was another stock that looked interesting on the surface, but did not pass the full valuation test.
That was the pattern across much of the list.
Some stocks looked cheaper than usual, but still not cheap enough.
Others had strong brands, attractive dividends, or impressive long-term histories, but the current numbers did not support enough margin of safety.
Kimberly-Clark was a good example of a defensive dividend stock where the yield looked tempting, but the DCF did not show enough upside.
Nike was a good example of a famous brand where Wall Street still sees recovery potential, but the current fundamentals and valuation did not give me enough confidence to call it one of the best opportunities near 52-week lows.
And that is exactly why this screen was useful.
It forced me to separate three very different groups of stocks.
The first group were stocks that looked cheap, but where the underlying business trends were too weak.
The second group were stocks that were good businesses, but where the valuation was only fair.
And the third group were the rare names where the business quality, valuation, and margin of safety all lined up.
That final group was much smaller than I expected.
After running the full screen, only two stocks gave me the combination I was looking for:
A business I would still want to own.
Assumptions I could reasonably defend.
And a valuation that left enough room for upside from here.
Those are the two stocks I would put at the top of the list today.
Here are the only two names that still offered the combination of quality and valuation support I was looking for.