
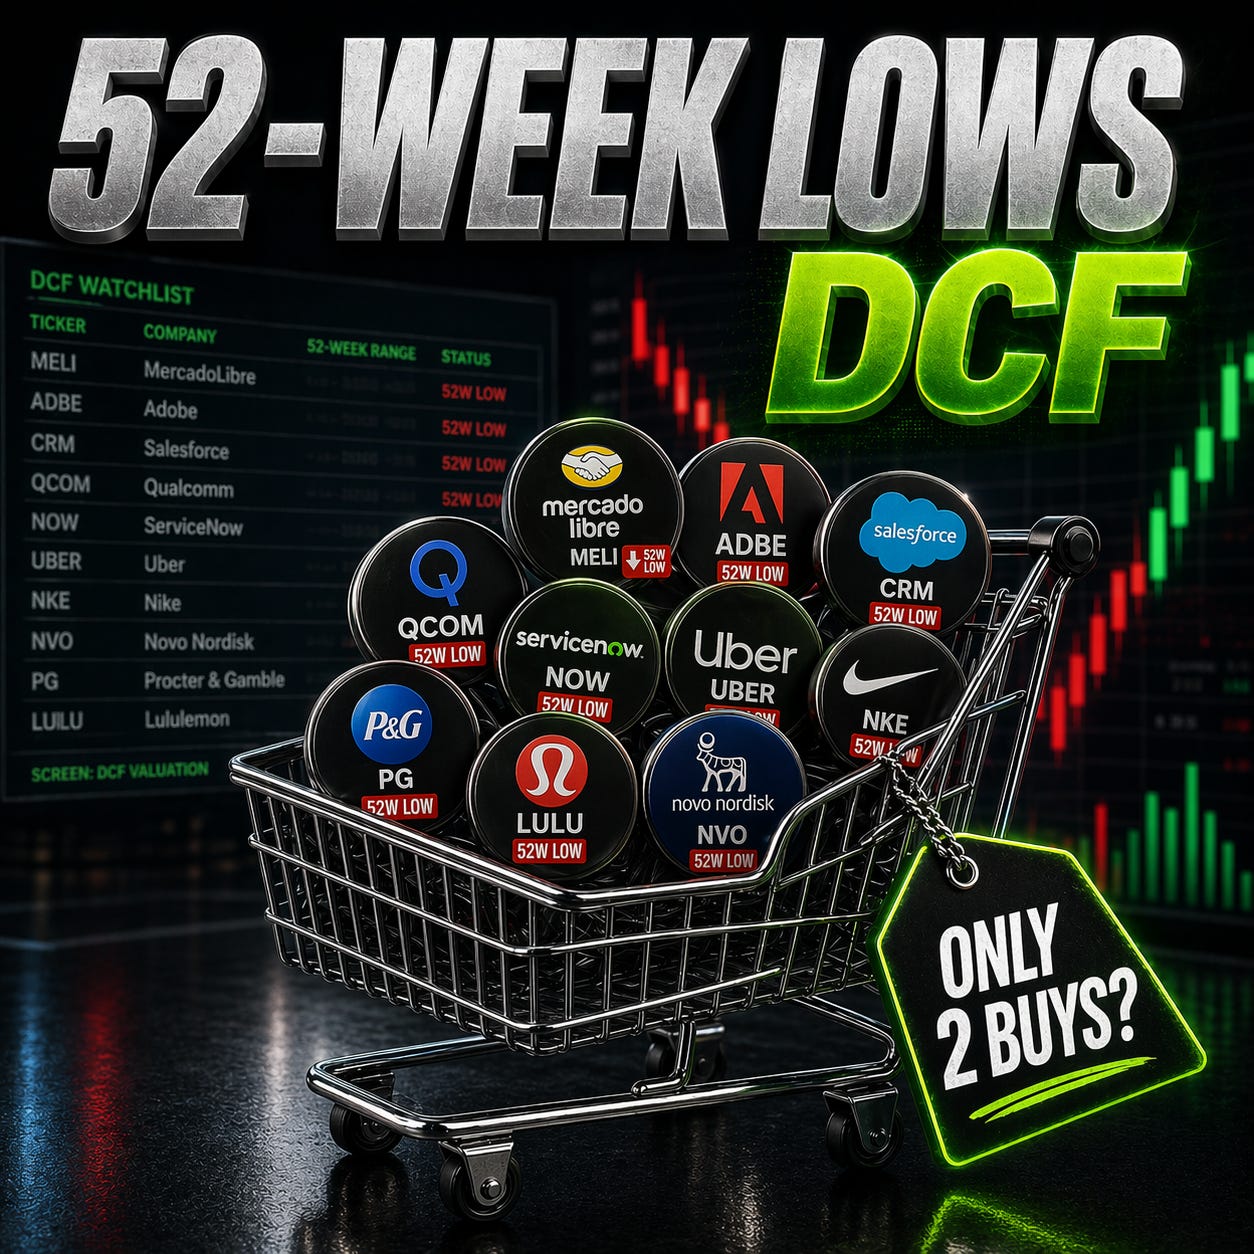
Most 52-Week Low Stocks Aren’t Buys. My DCF Found Only 2.
Cheap-looking stocks are everywhere right now. After reworking the valuations, only two still looked like real buys.

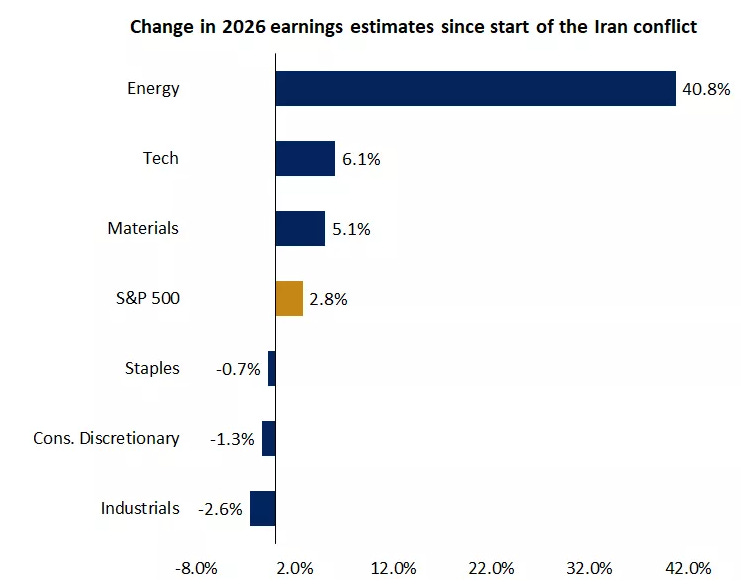
A few weeks ago, the market looked like it was pricing in something much worse.
Oil was surging.
Geopolitical risk was spiking.
Investors were de-risking fast.
And for a brief moment, it felt like the market was starting to brace for a much uglier outcome.
Now the mood has flipped.
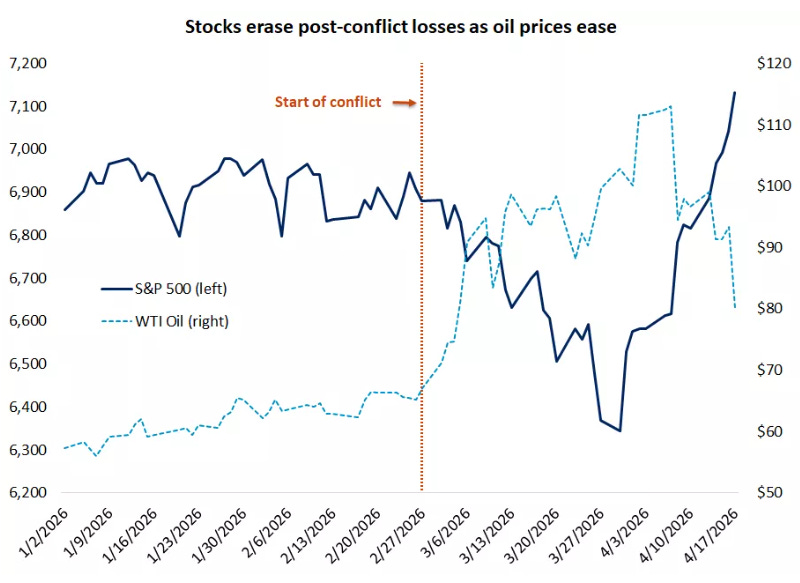
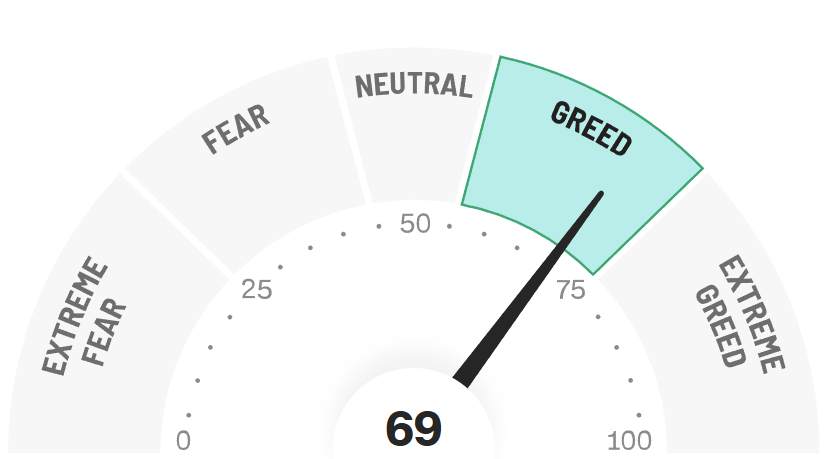
The S&P 500 has ripped back toward record highs. Oil has cooled off. Bond yields have steadied. And sentiment has recovered quickly enough that fear is already starting to give way to something closer to optimism again.
That is a big shift in a short period of time.
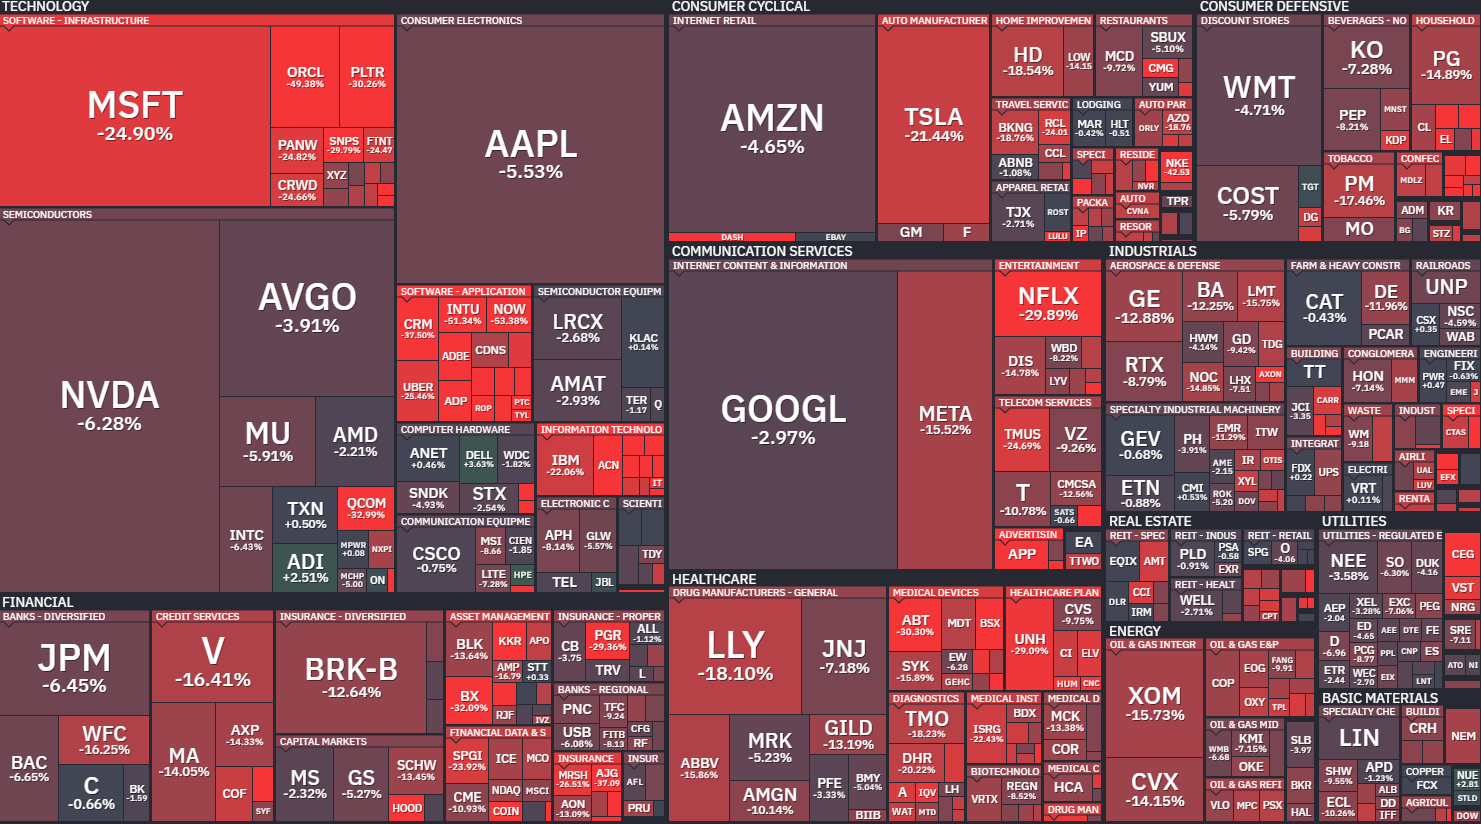
But under the surface, the picture is less clean than the headline indexes make it seem.
The broader market has recovered sharply, but plenty of individual stocks have not. A surprising number are still sitting near 52-week lows, even as the index pushes higher and investors start looking ahead to the next phase of the rally.
That matters now, because the market is entering a new test.
The panic phase was driven by headlines.
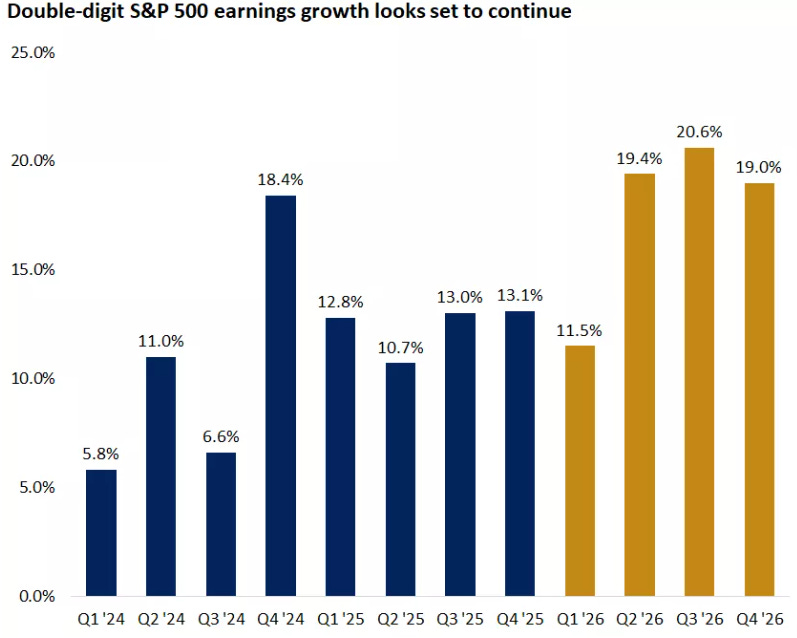
The next phase will be driven by earnings.

Over the next few weeks, investors are going to find out which companies were merely caught in the volatility… and which ones are actually facing weaker fundamentals, weaker demand, or a lower earnings power than the market used to assume.
That distinction matters.
Stocks at 52-week lows often look cheap on the surface. But low prices alone do not create value. In many cases, the market is simply correcting for weaker growth, weaker margins, or a business that deserves a lower multiple than it once had.
That is why I did not want to rely on price alone.
Instead, I re-ran the valuation work on a basket of stocks trading near 52-week lows, using a DCF-based framework to see which names still offered a real margin of safety - and which ones only looked cheap because the market had already priced in a weaker future.
Most did not make the cut.
Only two did.
Why most 52-week lows fail the test
A stock trading near a 52-week low can look tempting.
The price is down.
The chart looks ugly.
Sentiment is weak.
And that is often enough to make investors assume they are looking at value.
Sometimes they are.
But very often, they are not.
A stock does not become cheap just because it has fallen. In many cases, the decline is simply the market adjusting to a weaker reality - slower growth, lower margins, weaker guidance, rising competition, or a business that no longer deserves the multiple investors once gave it.
That is where a lot of people get caught.
They see the drawdown.
They anchor to the old high.
And they mistake a lower price for a better opportunity.
But the old high is not what matters.
What matters is what the business is worth today based on the cash it can generate going forward.
That is why I did not want to build this list around price action alone. I wanted to know which of these 52-week low stocks still offered enough upside based on future cash flows - and which ones only looked attractive because the market had already repriced them lower.
So I ran them through a DCF-based process.
Not as a perfect tool, because no valuation model is. But as a way to force discipline.
For each company, the key question was simple: does the current price still leave enough room for a compelling return, even under assumptions that are not overly generous?
That matters even more right now.
Because with earnings season underway, the market is about to become much less forgiving. Stocks that are already weak will need to show real resilience to stop sliding. And if they cannot, being near a 52-week low today may end up meaning very little.
That is why this screen was useful.
It helped separate the names that are merely down… from the names that may actually be undervalued.
The framework I used
There is no perfect way to value a stock.
A DCF is not a magic answer. Change the assumptions, and the output changes with them. But that is also exactly why it is useful. It forces you to be explicit about what has to happen for a stock to be worth buying.
For this screen, I was not trying to find the stocks with the biggest drawdowns or the most dramatic charts. I wanted to find the names where the current price still looked attractive relative to a realistic range of future cash flows.
So the process was built around a few simple questions.
1. Is the business still high quality?
The first filter was not valuation. It was quality.
If a company is near a 52-week low because the business itself is weakening, the lower price may not be an opportunity at all. It may just be the market catching up to a worse reality.
So I wanted businesses that still showed signs of durability - strong market position, healthy margins, resilient demand, and a model that can continue compounding over time.
2. Are the growth assumptions still believable?
This is where a lot of “cheap” stocks fall apart.
A stock can look optically inexpensive if investors are still anchoring to old expectations. But if the future growth path is now lower, the fair value is lower too.
So for each company, the key question was not whether it used to deserve a higher price. It was whether reasonable forward assumptions still supported upside from here.
3. Is the valuation leaving enough room for error?
This is the margin-of-safety test.
Even if the business is solid, that does not automatically make the stock a buy. The current price still has to leave enough room for decent returns without relying on perfect execution.
That is especially important in this kind of market. When sentiment swings quickly and earnings matter more, I do not want a valuation that only works if everything goes right.
4. Is the downside understandable and survivable?
Some stocks are at 52-week lows because the market is overreacting.
Others are there because the risks are real.
So I also wanted to understand what was actually driving the weakness. Was this mainly sentiment? A temporary slowdown? A margin reset? Or something more structural?
If the downside case looked too open-ended, or the business needed too many things to go right to recover, that was usually enough to move on.
5. Would I still want to own it if the recovery takes time?
This matters more than people think.
A stock near a 52-week low does not have to bounce quickly to be a good investment. But if the thesis only works on the assumption of a fast rerating, it is probably not a very strong thesis.
The names that stood out were the ones where I could still make the case even if the market stayed cautious for a while.
What this process was really designed to do
At a high level, this was not a hunt for the most beaten-down stocks.
It was a hunt for the mispriced ones.
That is a very different exercise.
A large drawdown can create opportunity. It can also create noise. And when a stock is sitting near a 52-week low, the easiest mistake is to assume the discount is the opportunity.
Sometimes it is.
But often, the market is simply telling you that the business, the expectations, or the valuation had to reset.
This framework was my way of filtering that out.
Because the goal was not to find stocks that looked cheap compared with where they used to trade.
It was to find stocks that still looked attractive based on what they can realistically earn from here.
Once I put the list through that lens, the field narrowed quickly.
A stock that failed the test: Novo Nordisk
Novo Nordisk looked tempting at first glance.
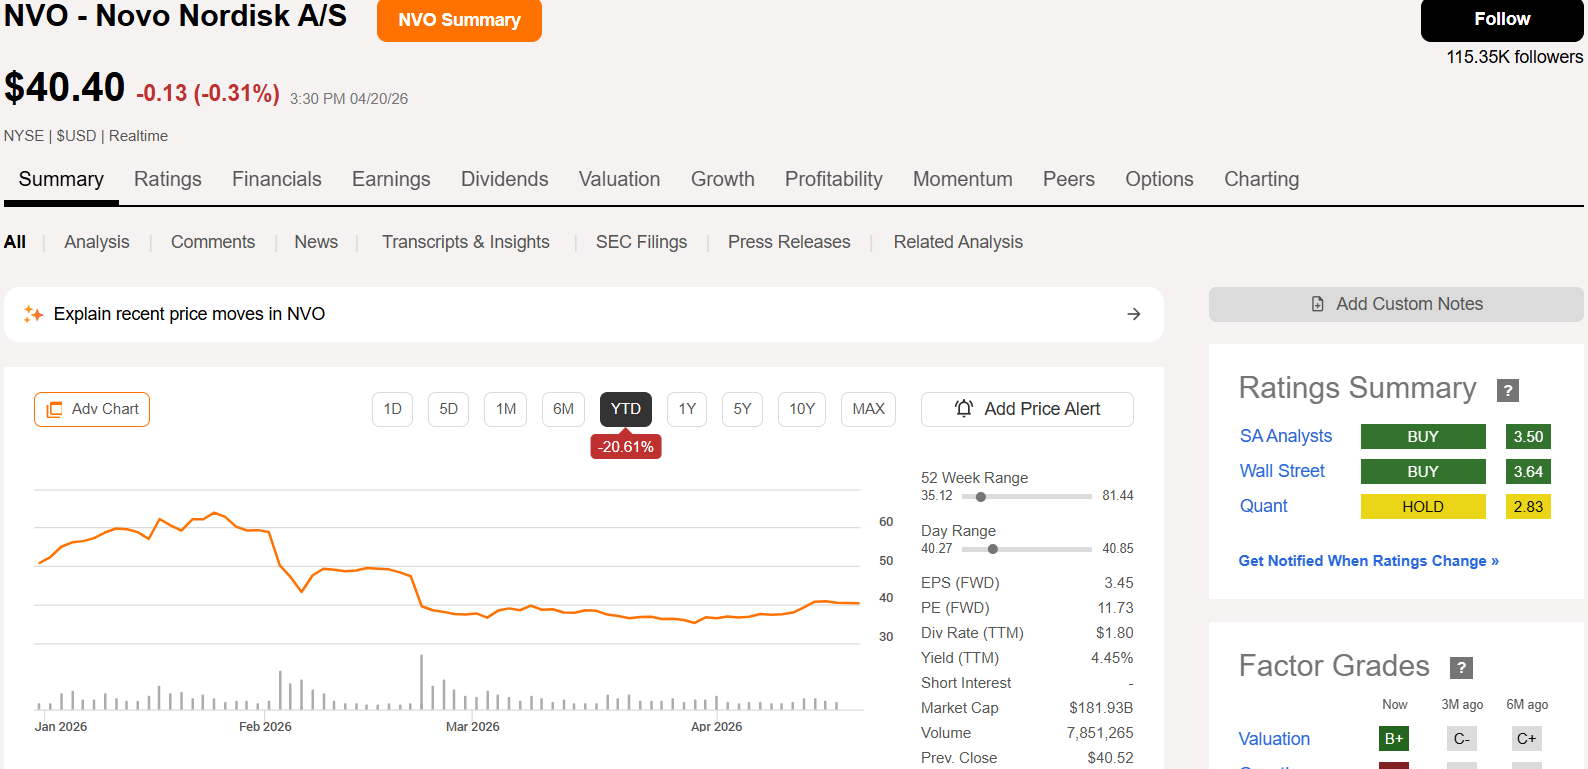
The stock is near its 52-week low.
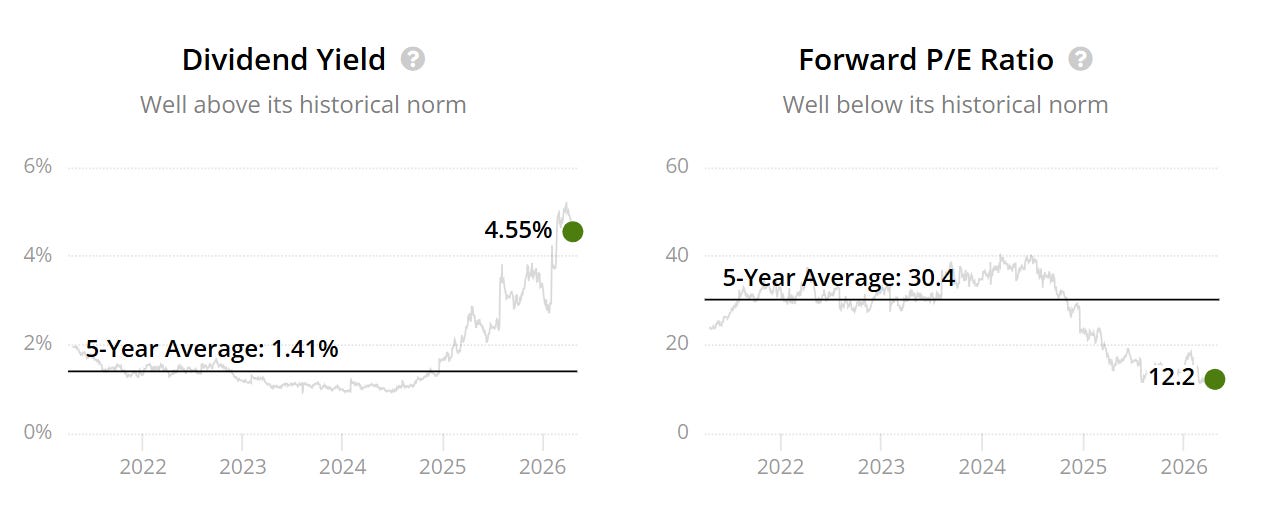
Its forward P/E has compressed to about 12x, far below its five-year average of roughly 30x. Its dividend yield has jumped to around 4.6%, which is also well above normal.
That is exactly the kind of setup that can pull investors in.
But when I ran the DCF, the story changed.
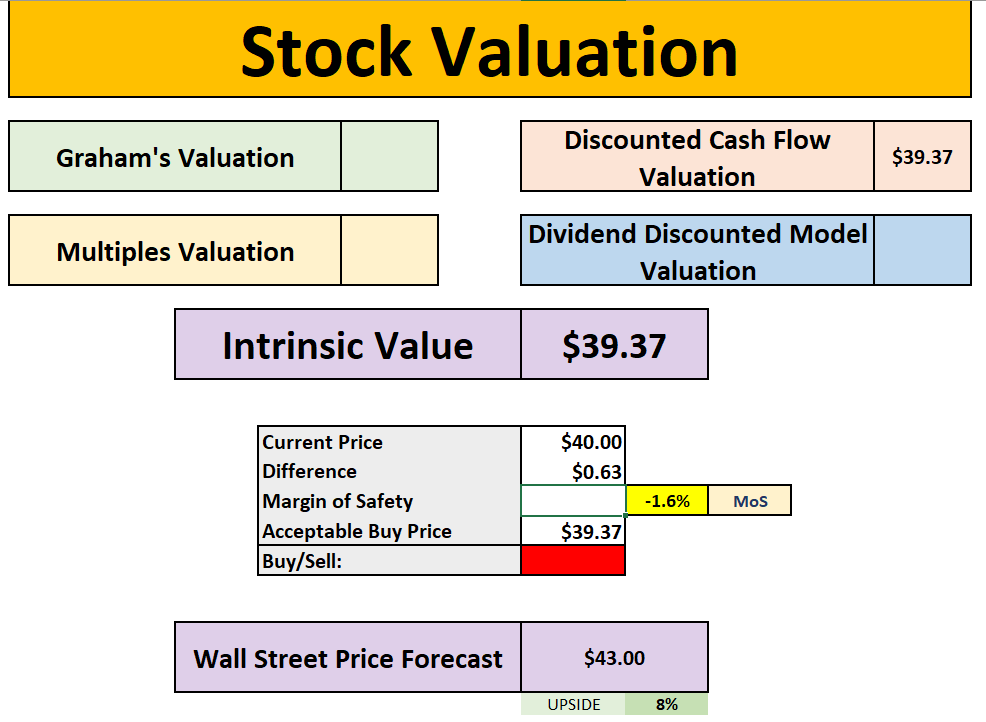
My intrinsic value came out at roughly $39.37, versus a market price around $40, leaving a negative margin of safety of about 1.6%. Even the implied upside to the Wall Street target was only around 8%.
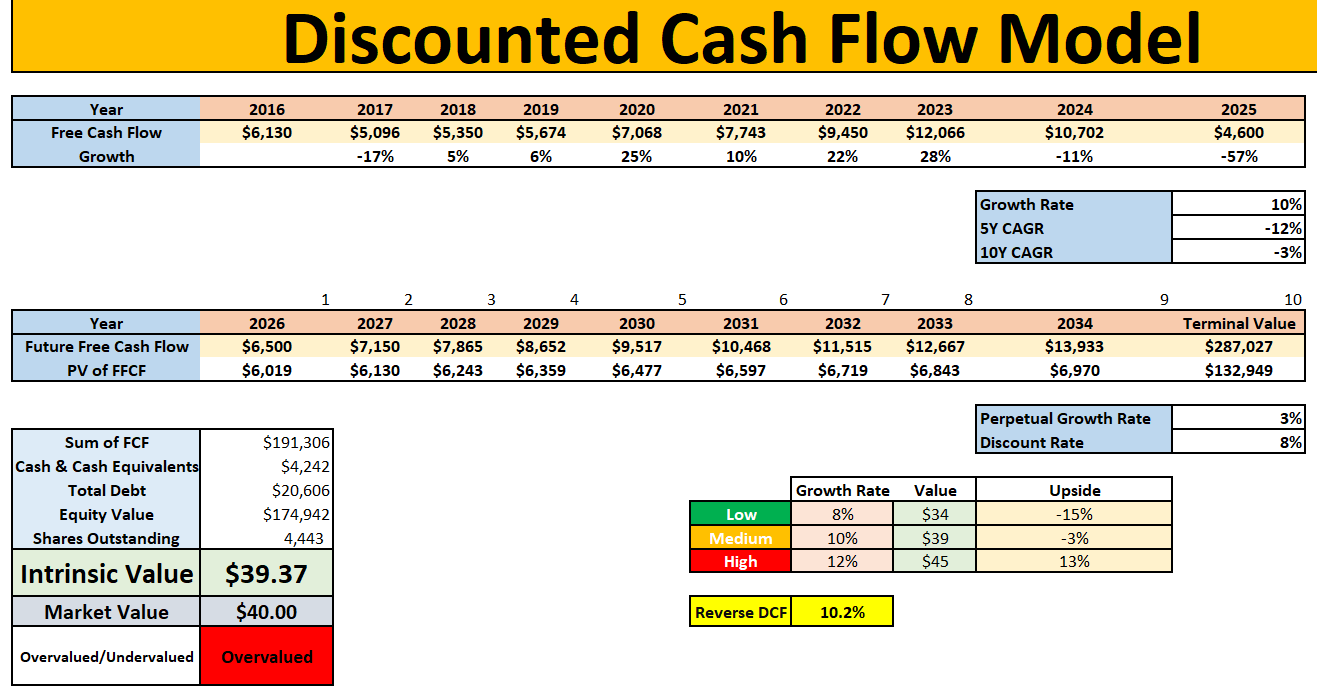
So while Novo looked much cheaper than usual, it still did not look cheap enough.
That is the difference between a stock being down a lot and a stock being undervalued.
Novo may recover over time. But for this list, it did not offer enough valuation support to make the final cut.
A stock that came close, but still did not make the cut: Medtronic
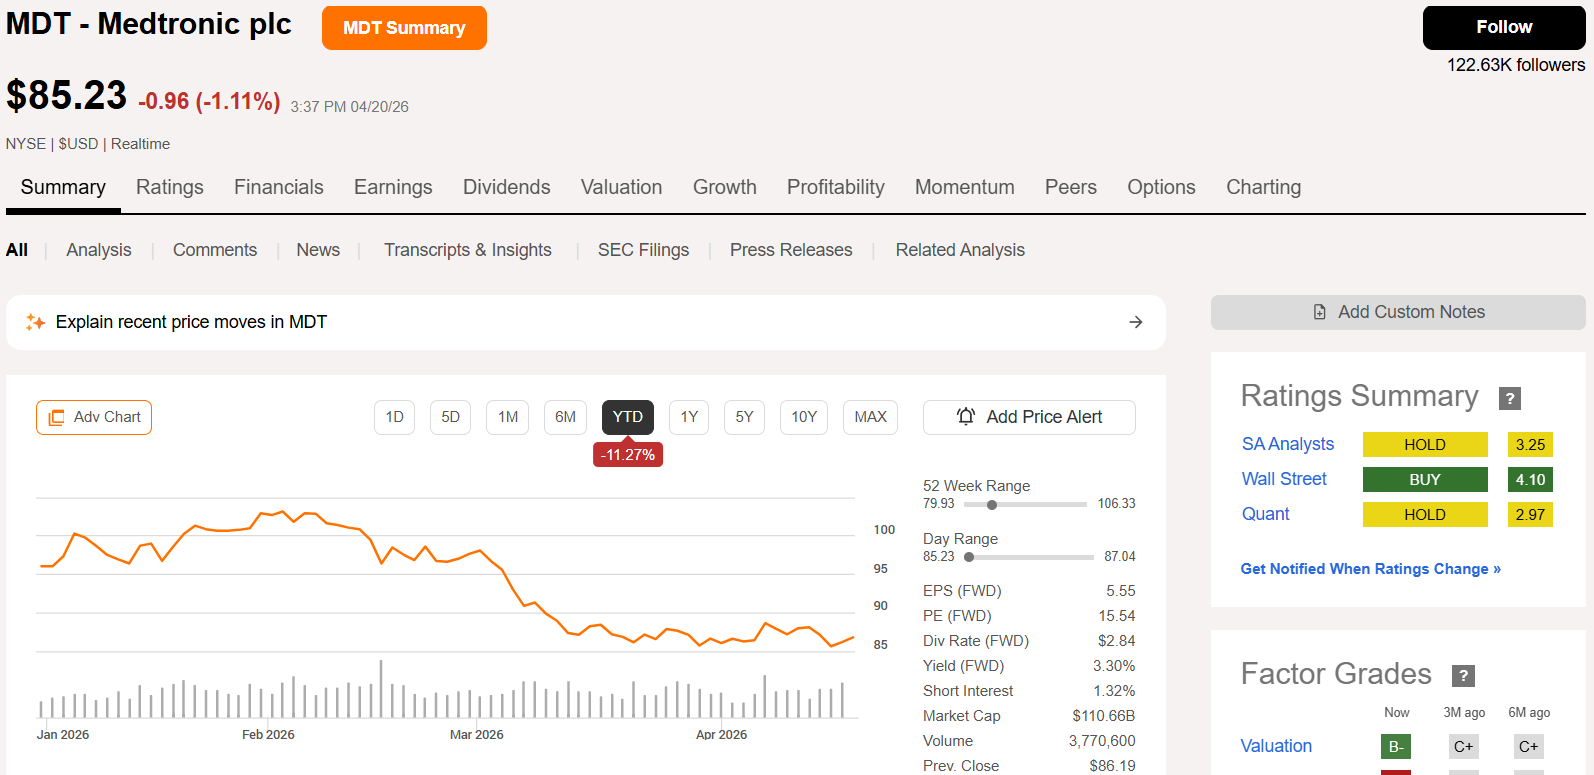
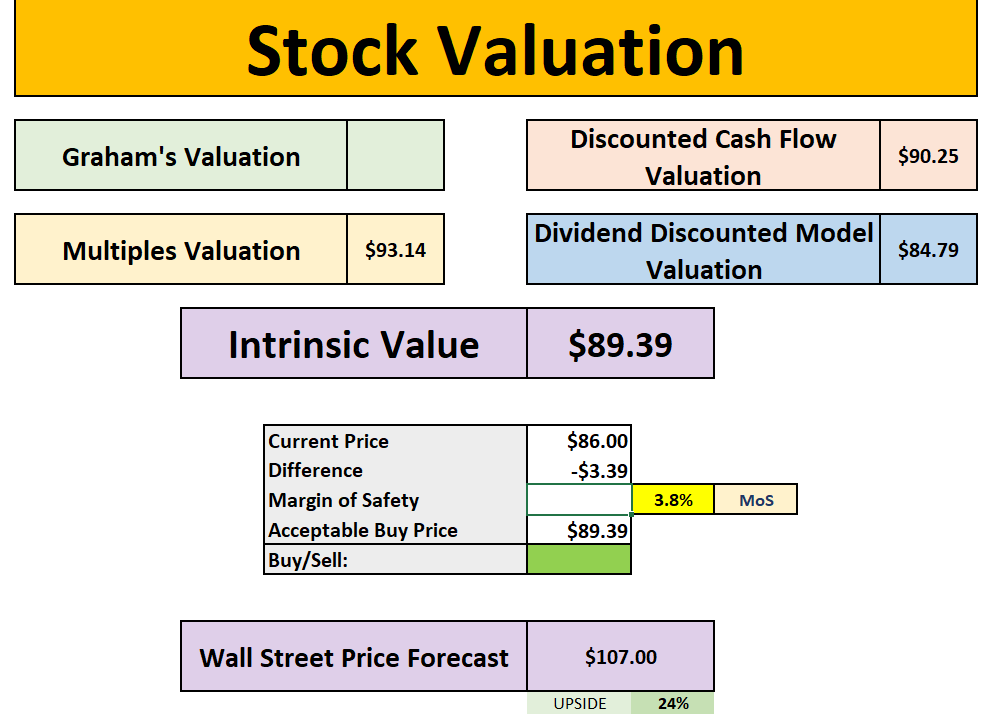
Unlike Novo Nordisk, Medtronic did not fail because it still looked outright overvalued on my numbers.
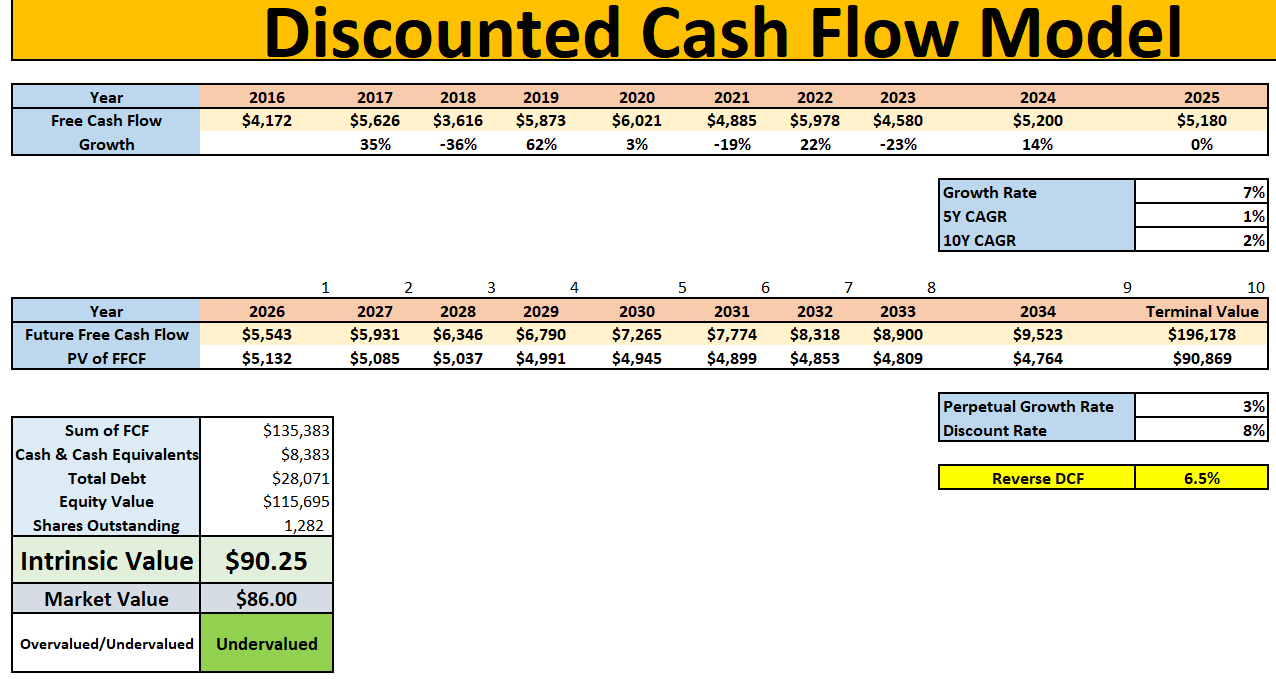
If anything, the stock looked roughly fairly valued to modestly undervalued, with my DCF pointing to value in the high $80s to low $90s against a share price around $86.
But that was also the problem.
For this list, I was not looking for stocks that merely looked reasonable. I was looking for names where the valuation itself created a more obvious opportunity.
And Medtronic did not quite get there.
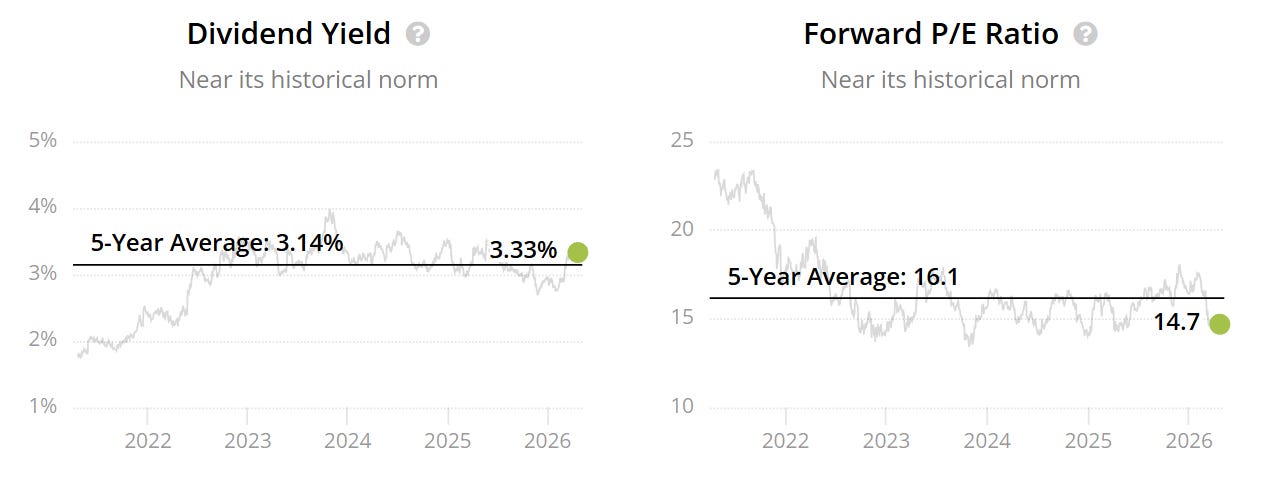
The forward P/E and dividend yield also sit close to their historical norms, which makes this look less like a market overreaction and more like a stock trading in a range that is broadly understandable. There may be upside from here, and the Wall Street target suggests as much, but the valuation discount was not wide enough for me to put it in the top tier.
So Medtronic was not a clear reject in the same way as Novo Nordisk.
It was more of a near miss.
A stock I could understand owning, but not one that stood out enough to make my final cut when I was specifically looking for the strongest opportunities near 52-week lows.
That was the pattern across much of the list.
Some stocks looked cheaper than usual, but still not cheap enough. Others were solid businesses, but the valuation discount was too thin to make them stand out. And a few simply needed too much to go right.
In the end, only two names offered the combination I was looking for:
a business I still wanted to own
assumptions I could reasonably defend
and a valuation that left enough room for upside from here
Here are the two names that still offered the combination of quality and valuation support I was looking for.