
Put These 2 Stocks On Your Watchlist
+ Market Update


Market Latest

Last week, the S&P 500 declined by 1.30%, reflecting investor concerns over strong job market data potentially sustaining inflation and high interest rates.
As economic strength improves, the likelihood of additional central bank rate cuts has now decreased.
Consequently, government bond yields rose last week, leading to a decline in stock markets.
Although higher rates may pressure valuations and cause occasional volatility, the bull market remains intact if supported by expected earnings growth in the year ahead.
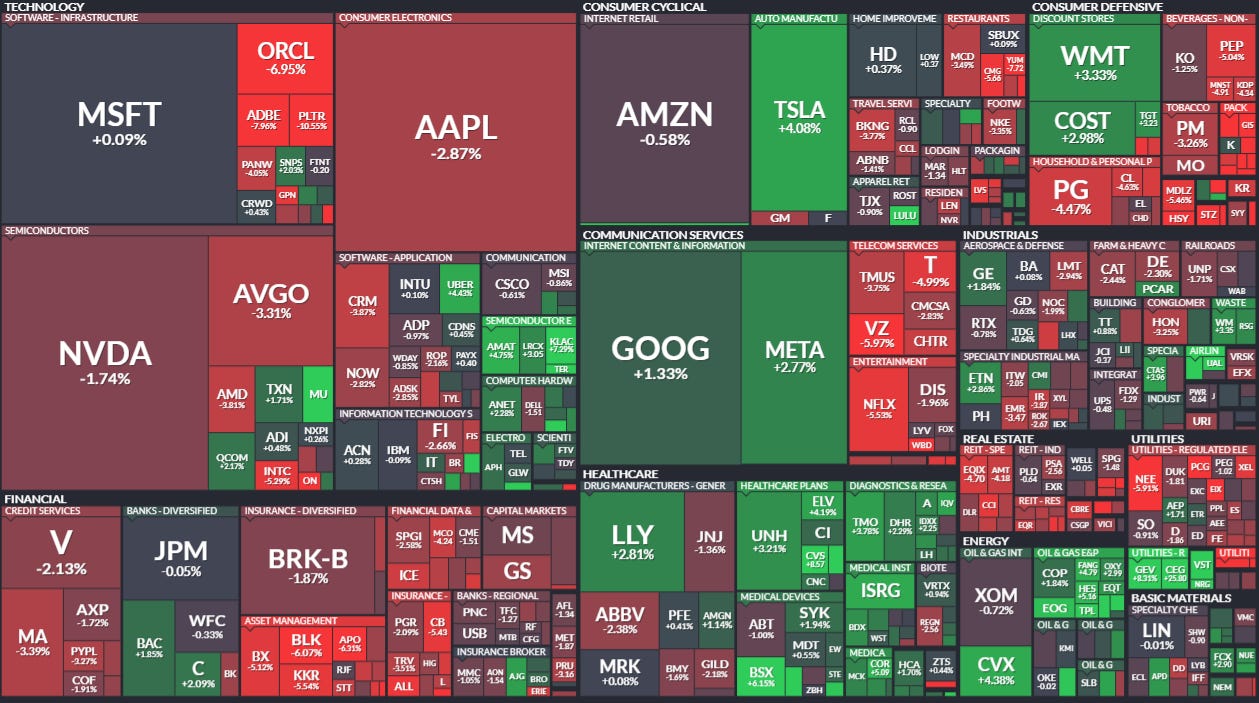
Last week we saw the continuation of a red market, with most stocks down.
Biggest losers included:
Palantir (PLTR) down 11%
Adobe (ADBE) down 8%
Verizon (VZ) down 6%
Global Payments (GPN) down 6%
Hershey (HSY) down 6%
Blackrock (BLK) down 6%
NextEra Energy (NEE) down 6%
Intel (INTC) down 5%
Procter & Gamble (PG) down 5%
and many others.
Notable News
Strong Labour Market
The first job reports of 2025 for the U.S. and Canada surpassed expectations.
In the U.S., December nonfarm payrolls increased by 256,000, significantly exceeding the forecast of 165,000, while the unemployment rate dropped to 4.1% from 4.2%.

Average hourly wages grew by 3.9% year-over-year, just below the anticipated 4.0%, suggesting a potential moderation in services inflation.

The employment data highlights two encouraging trends for economic growth.
First, unemployment rates in both economies (US & Canada) remain low, well below long-term historical averages, creating a favorable environment for consumers and businesses alike.
Second, wage growth continues to outpace inflation in both the U.S. and Canada, ensuring workers enjoy positive real wage gains. This bolsters consumer confidence and supports spending.
Stock Market Down
Despite the positive jobs reports, financial markets reacted negatively to the news.
This was partly due to a reassessment of the need for additional central bank rate cuts.
According to the CME FedWatch tool, markets now anticipate only one more Federal Reserve rate cut in 2025, likely in July, which would lower the federal funds rate to 4.0%–4.25%.

As a result, government bond yields rose sharply, with short-term yields seeing the most significant increase due to their closer ties to central bank policy rates.
The higher yields put pressure on stocks, particularly in the segments with the highest valuations.
In U.S. markets, the tech-heavy Nasdaq lagged, while defensive sectors such as utilities and health care showed greater resilience.
Donald Trump Inauguration Soon
In the U.S., Inauguration Day is fast approaching, with President-elect Trump set to take the oath of office on January 20.
The incoming administration has outlined several key policy priorities, including tariffs, immigration and energy reform, deregulation, and tax cuts. However, it remains unclear which initiatives will take precedence in the coming weeks.
This uncertainty over policy priorities and their sequencing could weigh on markets. Policies perceived as more inflationary, such as tariffs and immigration reform, may prove more disruptive.
Conversely, a focus on pro-growth measures like deregulation and tax cuts could lead to a more favorable market response.

Earnings This Week
Earnings season for 2025 has kicked off and one to look out for is Taiwan Semiconductor (TSM) before market opens on Thursday.
This may give us an indication of how the semiconductor space is doing.

We would love to have you in our community which is over 72,000 on YouTube where we cover in depth analysis of undervalued quality stocks and their earnings:

Fear and Greed Index

The Fear and Greed Index, which gauges investor sentiment on a scale from 0 (Extreme Fear) to 100 (Extreme Greed), currently stands at 27, indicating a state of fear in the market.
Several factors contribute to this sentiment:
Market Volatility: There's an expectation of increased stock market volatility in 2025, with the VIX index projected to rise closer to 20. This anticipated volatility is causing investor apprehension.
Political Uncertainty: The potential for heightened trade tensions in the second Trump administration and concerns about political instability are contributing to market unease.
Economic Indicators: Investors are wary of risks to market stability, including the possibility of a global trade war, a downturn in the U.S. tech sector, inflation, and rising bond yields. These concerns are influencing market sentiment.
Market Corrections: Some analysts believe the stock market is at a high point, making it susceptible to corrections or downturns. Widespread investor optimism, comparable to past speculative bubbles, is raising caution among market participants.
These factors collectively contribute to the current Fear and Greed Index reading of 27, reflecting a cautious and fearful investor sentiment.
2 Stocks For The Watchlist
Let us dive into the 2 High Quality Stocks we like.
I have used the following criteria to help identify these stocks:
Dividend Safety 60+ (Safe)
ROIC 10%+
Net Debt to EBITDA below 3 (Strong Balance Sheet)
Upside > 20%
S&P Global Inc
S&P Global Inc. (SPGI) provides financial information, analytics, and credit ratings. It operates across sectors like market intelligence, indices, ratings, and commodities, helping businesses and investors make informed decisions.
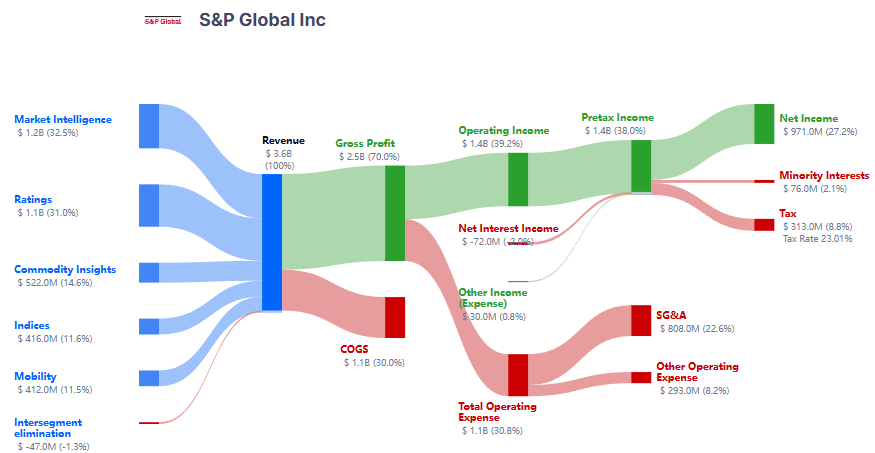
S&P Global's income streams come from four main segments:
Ratings: Revenue from providing credit ratings and risk assessments for bonds, companies, and governments.
Market Intelligence: Subscription-based revenue from data, research, and analytics services for financial markets.
S&P Dow Jones Indices: Licensing fees from benchmarks like the S&P 500, often tied to ETFs, mutual funds, and derivatives.
Commodities Insights & Mobility: Revenue from providing data and analytics for energy, commodities, and automotive industries.

They have outperformed in 3 of the last 4 quarters (vs analyst expectations) and anticipate growth against the year-on-year EPS comparative for the next year.

They have massively outperformed against the S&P 500 over the last 10Y.

We currently get a reasonable valuation signal with yield marginally lower than the 5Y average (0.75% v 0.85%) and the forward P/E below the 5Y average (29.6x v 30.1x).

Dividend safety looks good, with a score of 99.

hey are also a Dividend King with 50 years of consecutively increasing the dividend.

ROIC, whilst inconsistent, sits at 10% on a trailing twelve-month basis.

Balance sheet also looks good with Net Debt to EBITDA sitting at 1.50 on a trailing twelve-month basis.

As per below, Wall Street see 22% upside over the next 12 months.

When we last ran it through our valuation model our intrinsic value came to $533:
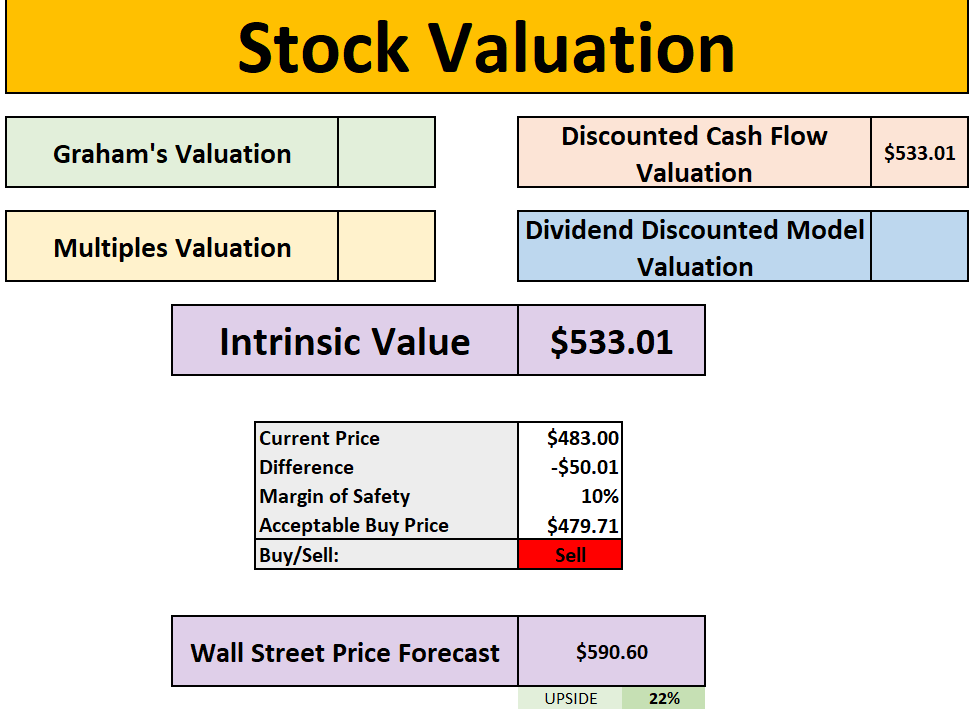
So, in conclusion for SGPI, we see around a 10% margin of safety around the $480 mark with Wall Street indicating 22% upside.
Whilst we believe this is a high-quality stock, we would wait for a larger margin of safety before adding.
Microsoft (MSFT)
Microsoft (MSFT) develops and sells software, hardware, and cloud services, including its flagship products like Windows, Office, Azure, and Xbox. It generates revenue through software licenses, subscriptions, cloud computing, hardware sales, and digital advertising.

Microsoft's income streams include:
Productivity and Business Processes: Revenue from Office, Microsoft 365, LinkedIn, and Dynamics software and services.
Intelligent Cloud: Income from Azure, server products, and cloud services.
More Personal Computing: Revenue from Windows licenses, Surface devices, Xbox gaming, search advertising, and other hardware.

They have outperformed in the last 4 quarters (all beats vs analyst expectations) and anticipate growth against the year-on-year EPS comparative.
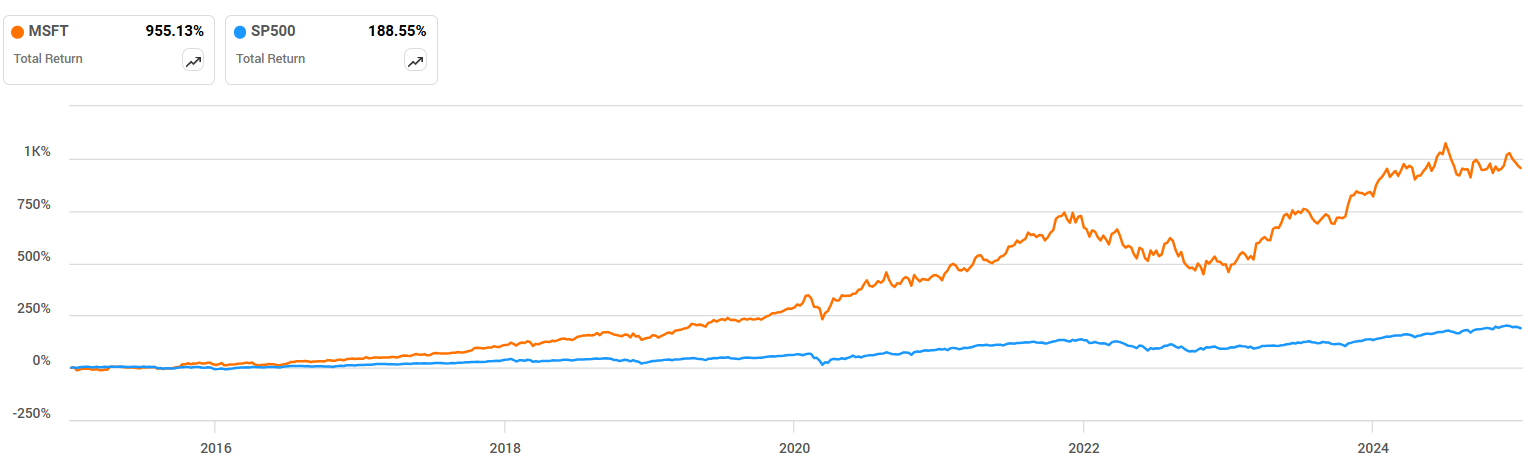
They have massively outperformed against the S&P 500 over the last 10Y.

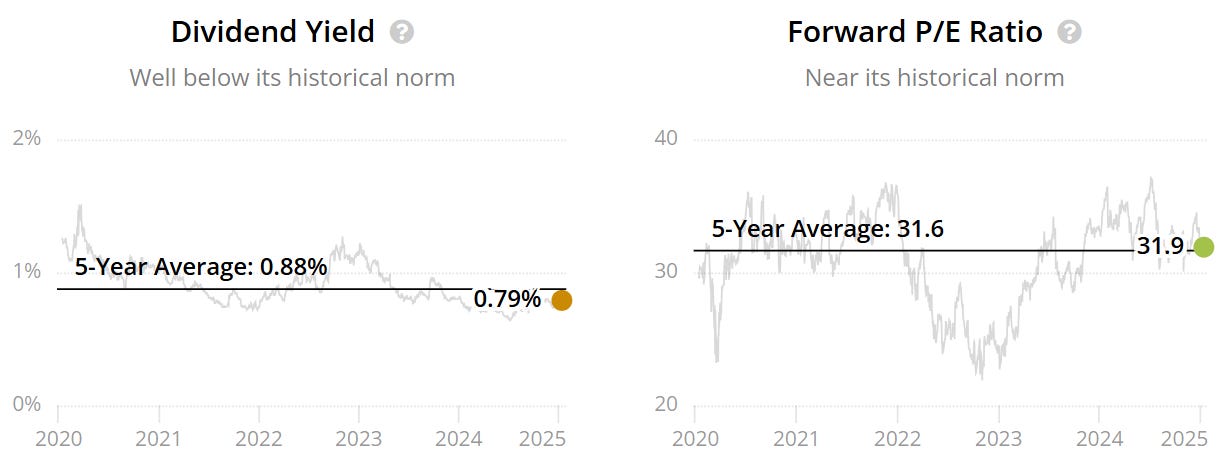
We currently get a reasonable valuation signal with yield marginally lower than the 5Y average (0.79% v 0.88%) and the forward P/E around the 5Y average (31.9x v 31.6x).
Dividend safety looks good, with a score of 99.

Dividend growth is also very impressive.

No issues with ROIC as it sits consistently around 30% over the last few years.

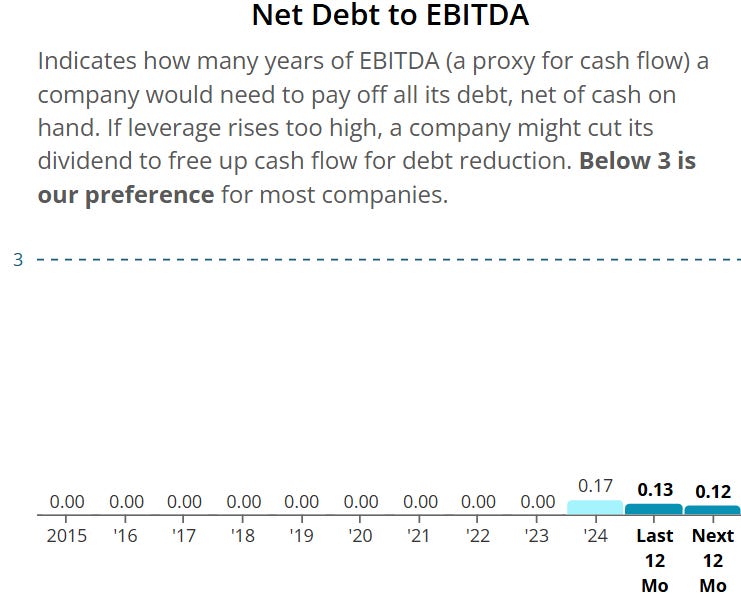
Balance sheet also looks very good with Net Debt to EBITDA sitting at 0.13 on a trailing twelve-month basis.
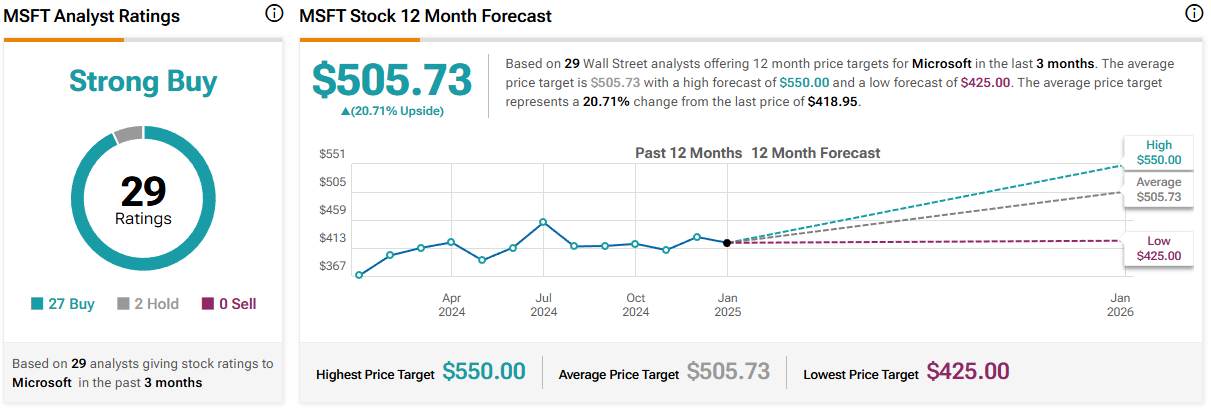
As per below, Wall Street see 21% upside over the next 12 months.
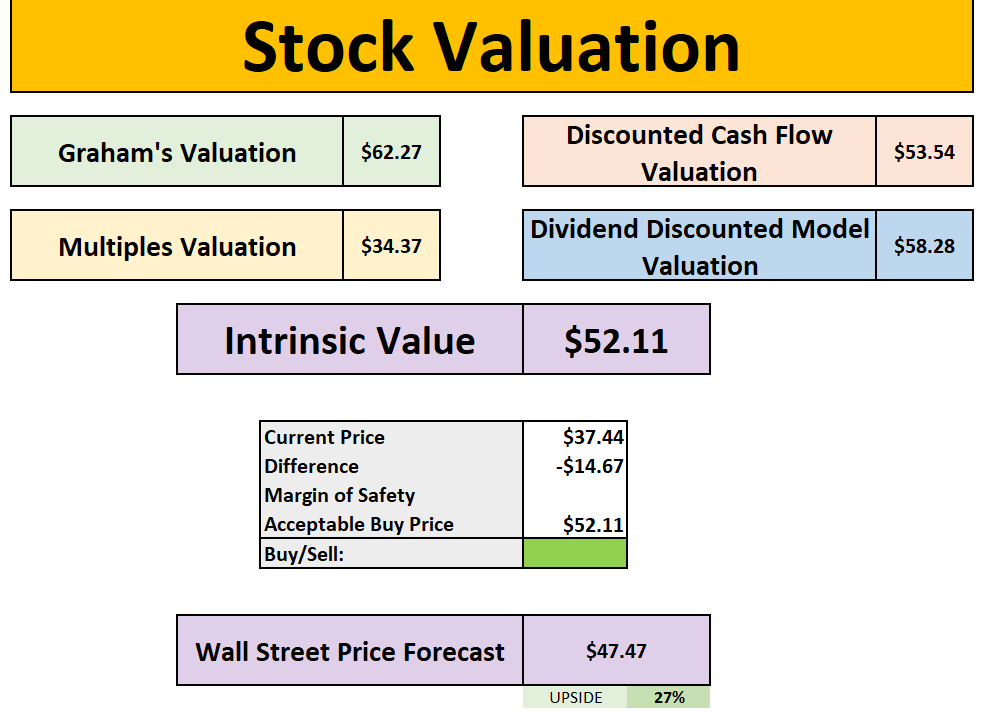
When we last ran it through our valuation model our intrinsic value came to $494:

So, in conclusion for MSFT, we see around a 15% margin of safety around the $420 mark with Wall Street indicating 21% upside.
Whilst we believe this is a high-quality stock, we would wait for a larger margin of safety before adding.
Stock Resources
Stock Valuation Model
If you are interested in valuing stocks yourself, we have created a valuation model below which you can pick up, this is the same version we use in our YouTube analysis:
Seeking Alpha

They are one of the main stock analysis websites I use in my videos and you can get $30 OFF discount below.
Patreon
Join our community in the Patreon where we discuss weekly buy and sells.
Snowball Portfolio Tracker

Snowball is a great portfolio tracker which allows you to have all of your investments in one place, with a ton of amazing features.
You can also get a 14-day free trial to check it out.
Conclusion
We have just gone through 2 cheap stocks to consider.
However as always do your own due diligence and let us know your thoughts about today’s newsletter in the comments.
I hope you all have a great week ahead!
Thanks For Reading!
If you’d like to support this work feel free to buy me a coffee. The proceeds will contribute to the running costs of the newsletter.
Join the community of investors - subscribe now to receive the latest content straight to your inbox each week and never miss out on valuable investment insights.
If you found today’s newsletter helpful, please consider sharing it with your friends and colleagues on social media or via email. Your support helps to continue to provide this newsletter for FREE!
Note:
I am not a financial advisor or licensed professional. Nothing I say or produce anywhere, should be considered as advice. All content is for educational purposes only. I am not responsible for any financial losses or gains. Invest and trade at your own risk.