


FICO has fallen almost 61% this year.
Its earnings estimates still point to growth. Its valuation has fallen far below the multiples investors were willing to pay a few years ago.
That combination is worth investigating. It is also where investors can make an expensive mistake: assuming that a dramatic share-price decline automatically creates the best opportunity.
This week, I’m comparing FICO with S&P Global and MSCI.
These are different businesses, but they share an attractive feature. They provide information, standards and tools that help the financial system make decisions. Their products can become embedded in customer workflows, and their relatively low capital requirements can support substantial cash generation.
The investment question is how much confidence we should place in that future cash flow, and what price leaves enough room for things to go wrong.
Before comparing the three, let’s look at the backdrop. It helps explain why a growing business can still become a disappointing investment.
The economy and the stock market are giving different signals
Inflation remains above the Federal Reserve’s target.
August’s official PCE report showed headline inflation of 3.4% year over year and core inflation of 3.0%. Core prices increased 0.2% during the month.
The chart below adds useful context: its three-month annualised core reading is lower than its twelve-month reading. That suggests recent momentum has improved, although a short run of better data does not settle the inflation outlook.
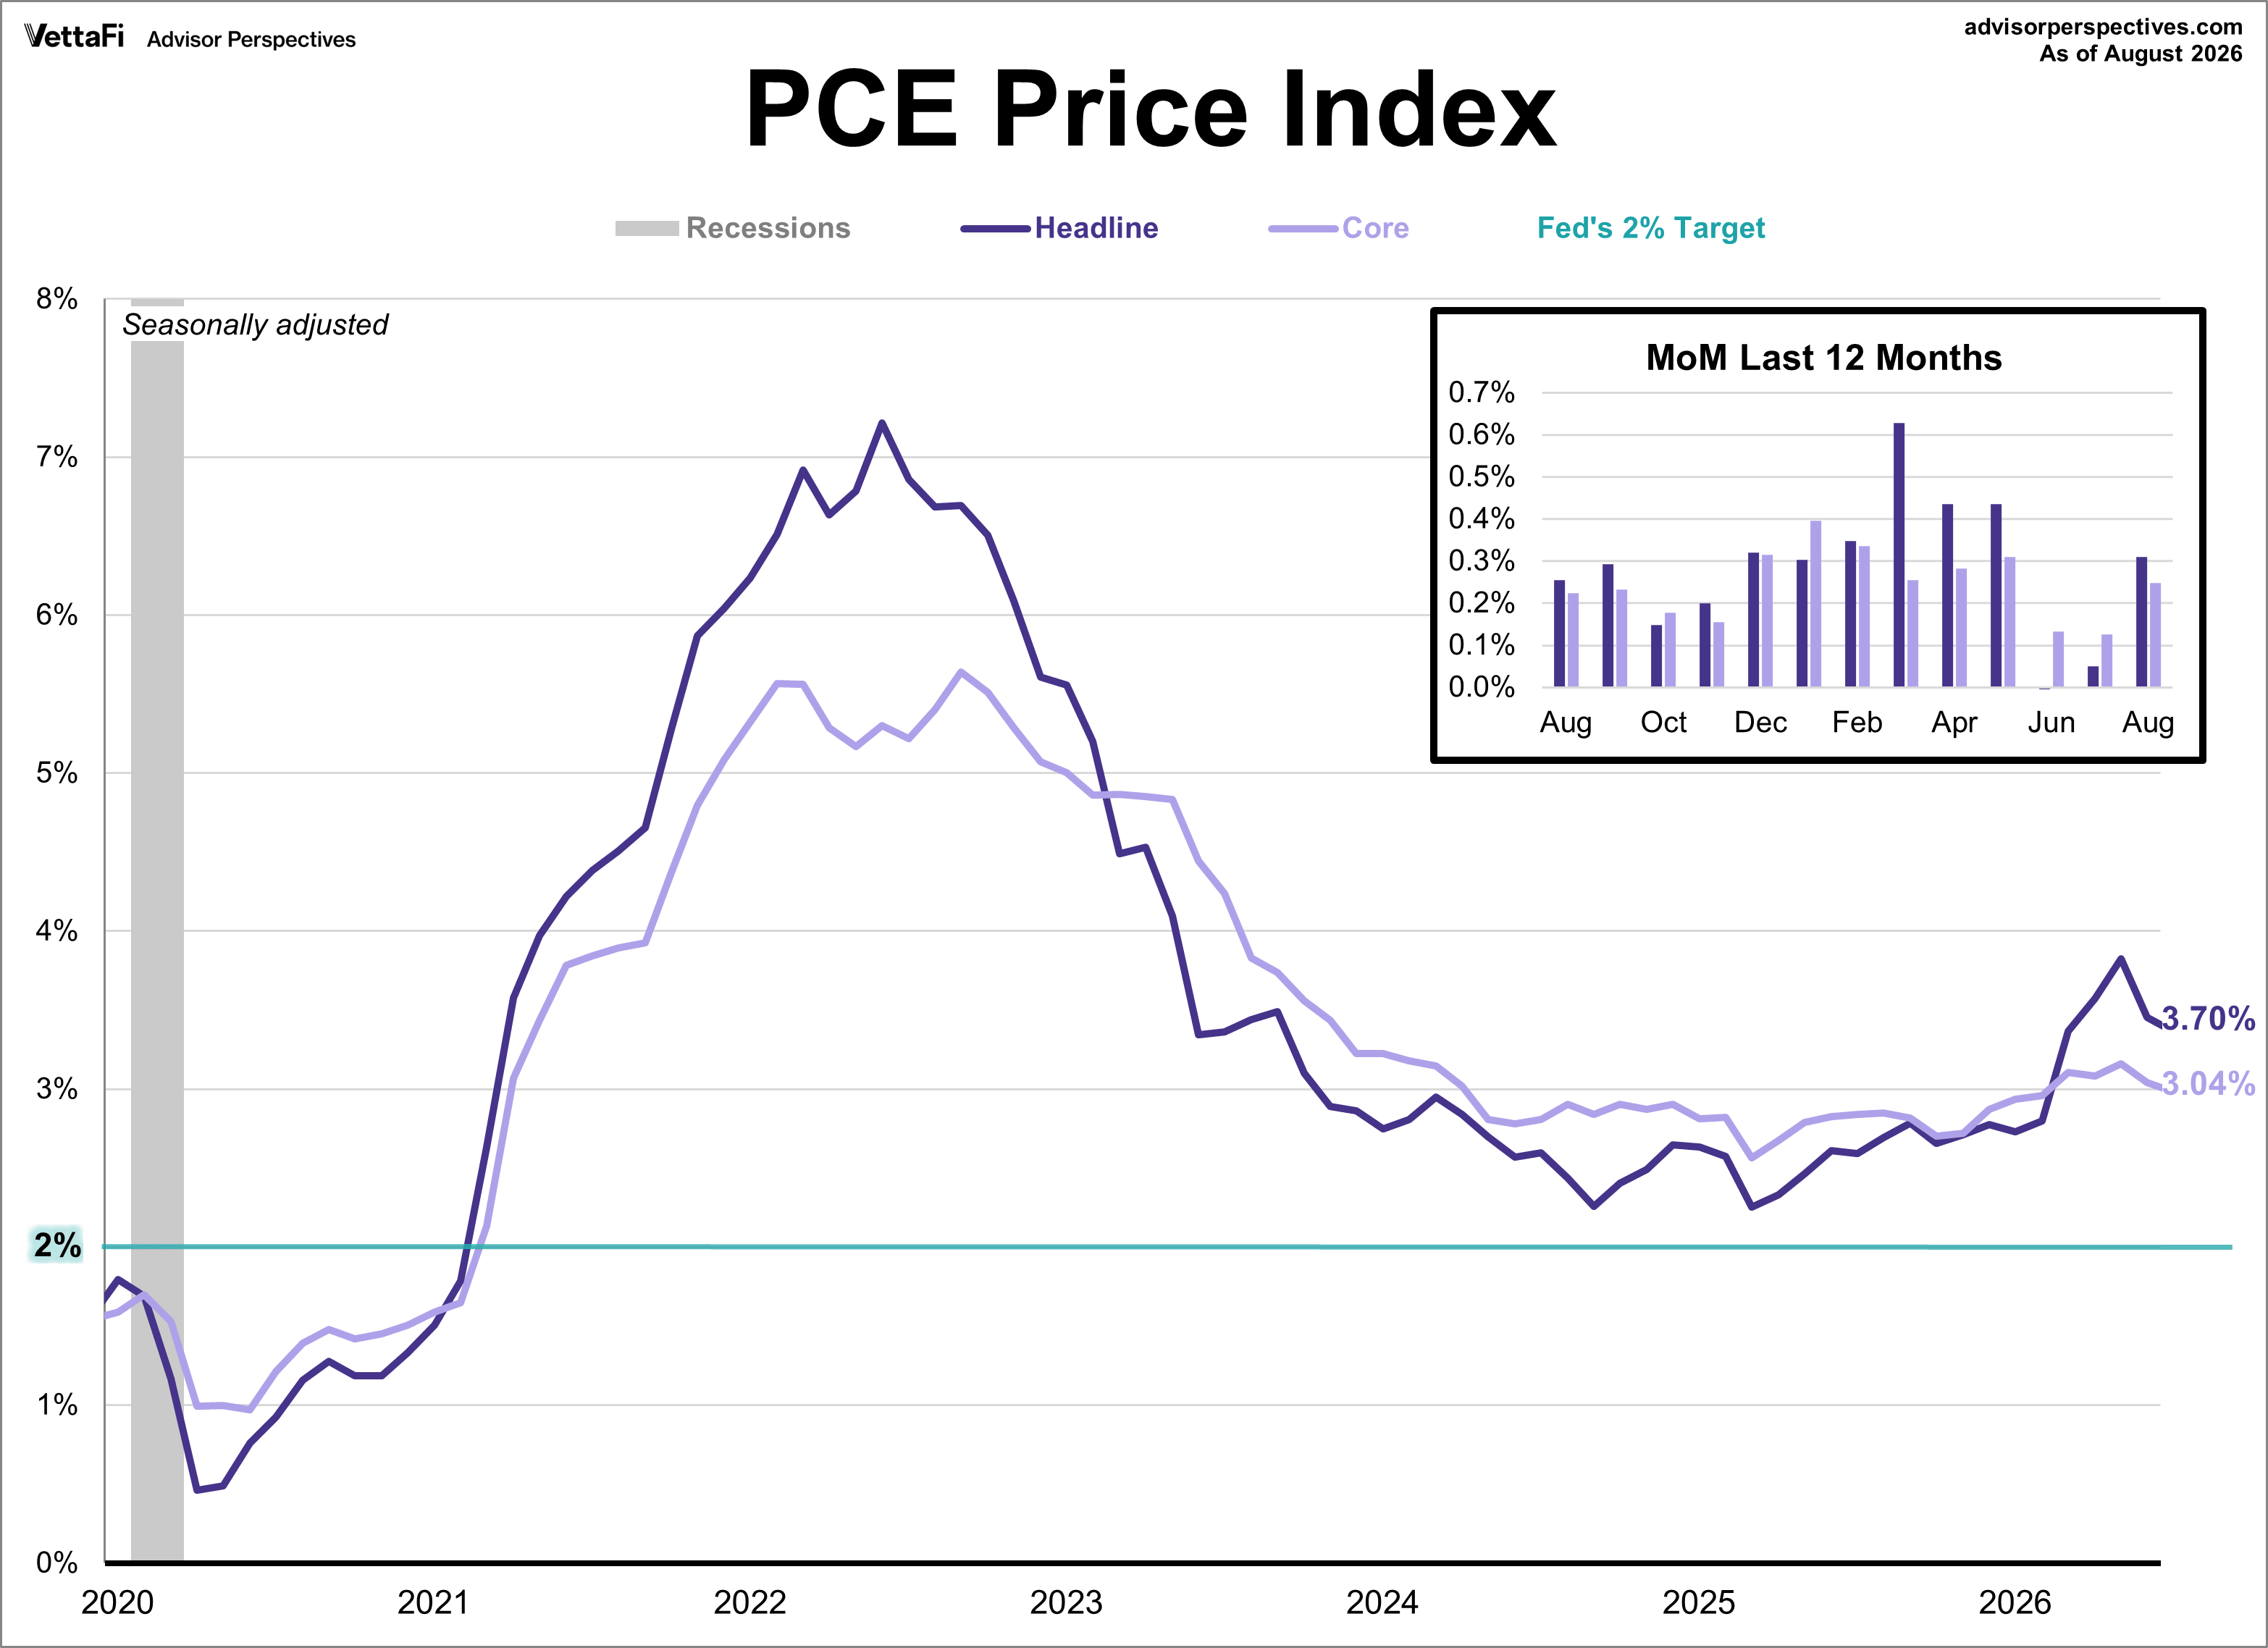
Shorter-term inflation momentum is lower than the twelve-month rate. The measures cover different periods.
Growth also deserves a balanced reading.
September added just 29,000 jobs, with unemployment at 4.2%. July and August payroll estimates were revised down by a combined 60,000. Those figures give us reasons to monitor weakness.
However, August’s real consumer spending increased 0.6%. Households were still spending, and the economy-wide corporate profits chart shows a recent upswing.
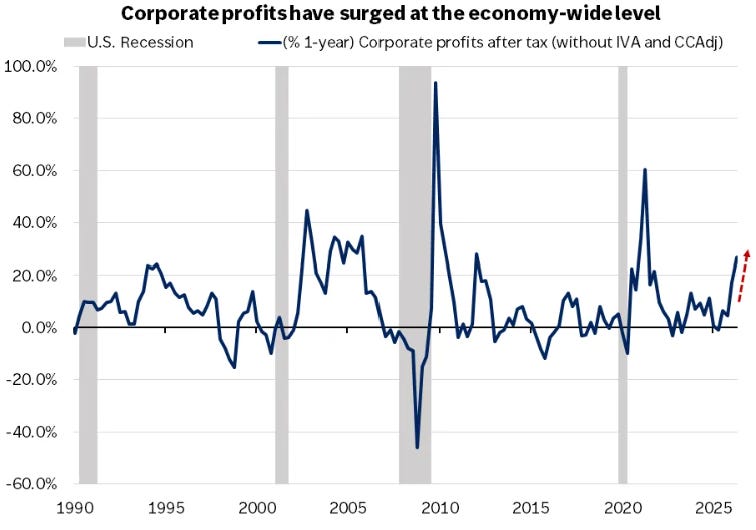
This chart tracks economy-wide after-tax corporate profits. It is a different measure from S&P 500 earnings per share.
My interpretation is that we should allow for an economy that keeps growing, while recognising that growth may become less evenly distributed.
That matters for stock selection. Strong aggregate profits can coexist with weak results at an individual business. A healthy market average does not guarantee that every company’s competitive position is intact.
There is another force at work: the return investors can earn elsewhere.
The Treasury chart below shows a US 10-year yield of 5.24%.
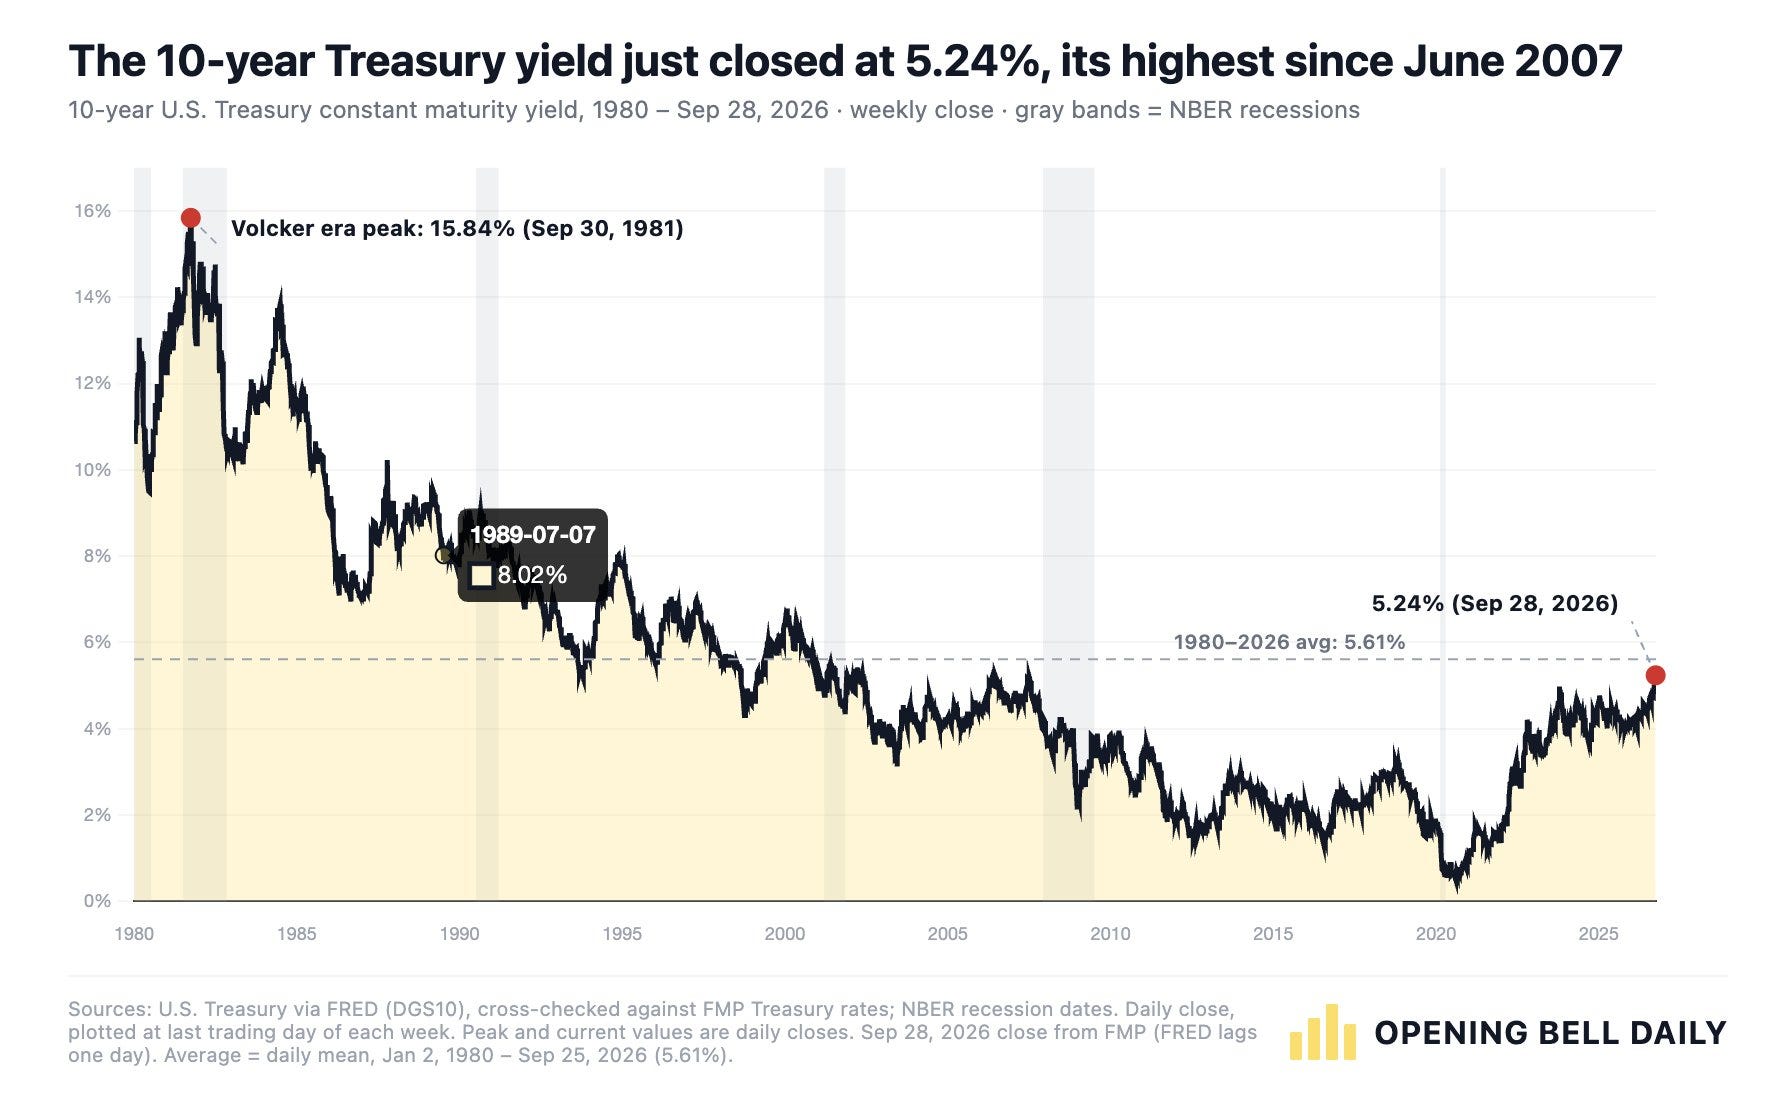
The chart’s 5.24% reading is dated 28 September 2026.
When bond yields rise, investors may demand more from equities too. A business can grow its earnings while its share price falls because investors are willing to pay a lower multiple for those earnings.
For companies whose valuations depend heavily on distant cash flows, a small change in the discount rate can make a large difference.
There are therefore two separate questions to answer this week:
Has the valuation become less demanding? And has the business become less dependable?
A multiple reset can create an opportunity when cash generation remains resilient. A weakening competitive position requires a different assessment, because the future cash-flow forecast itself may need to come down.
Three businesses, three different starting valuations
Here is the comparison using the fiscal-year earnings estimates:
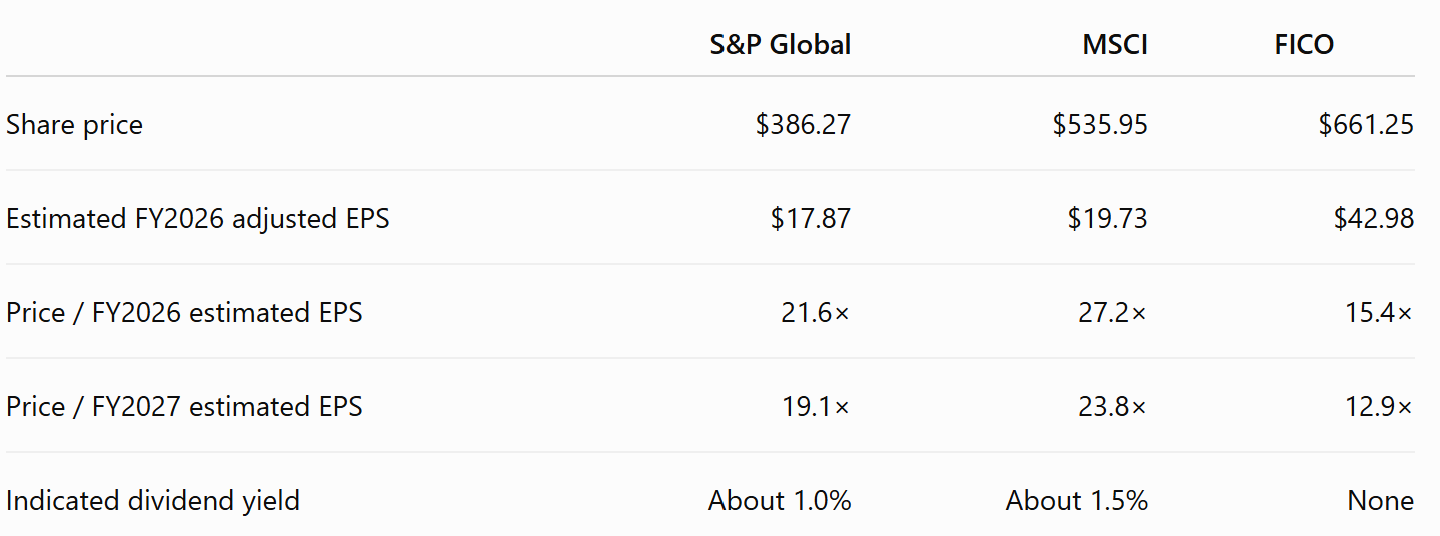
FICO looks cheapest on this earnings comparison. MSCI commands the highest multiple. SPGI sits between them.
SPGI also needs a particular adjustment to how we interpret its history. Mobility was separated in July, and shareholders received shares in the new company. The parent’s quoted share-price performance needs to be distinguished from the total return of an investor who retained that distribution.
The lesson applies beyond these three names: whenever a business changes scope, check that the historical earnings, cash flows and price comparisons describe the same economic interest.
New to Dividend Talks? Subscribe free for the weekly research and stock comparisons. Paid membership adds the full valuations, rankings and entry-price analysis.
FICO: what the headline valuation does not tell us
FICO’s decline is the most dramatic of the three.
At $661, that is a year-to-date fall of approximately 61%. It is also roughly 65% below its 52-week high.
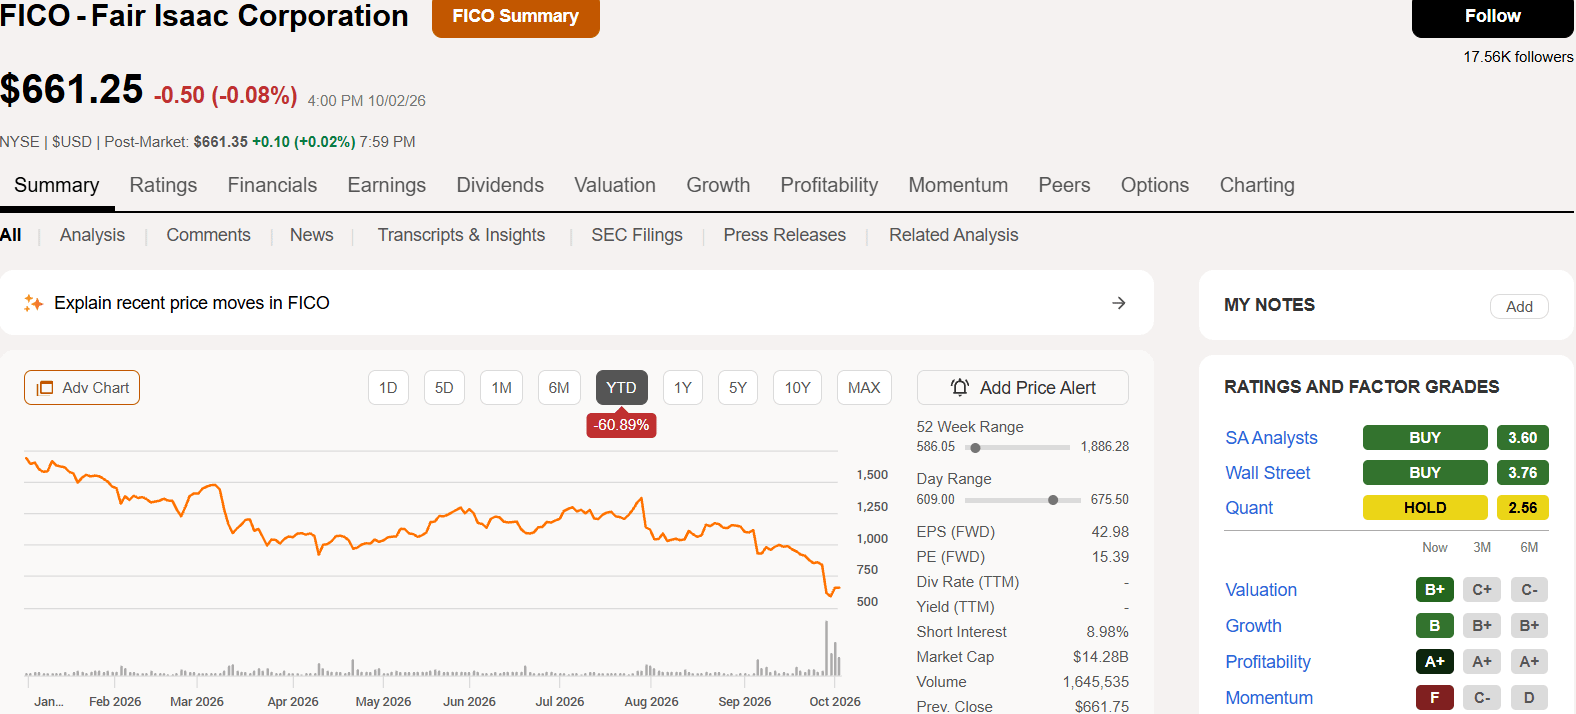
At that price, FICO trades at approximately 15.4 times estimated FY2026 adjusted earnings and 12.9 times FY2027 estimates.
The historical valuation snapshot puts its five-year average forward adjusted P/E at around 43.6.
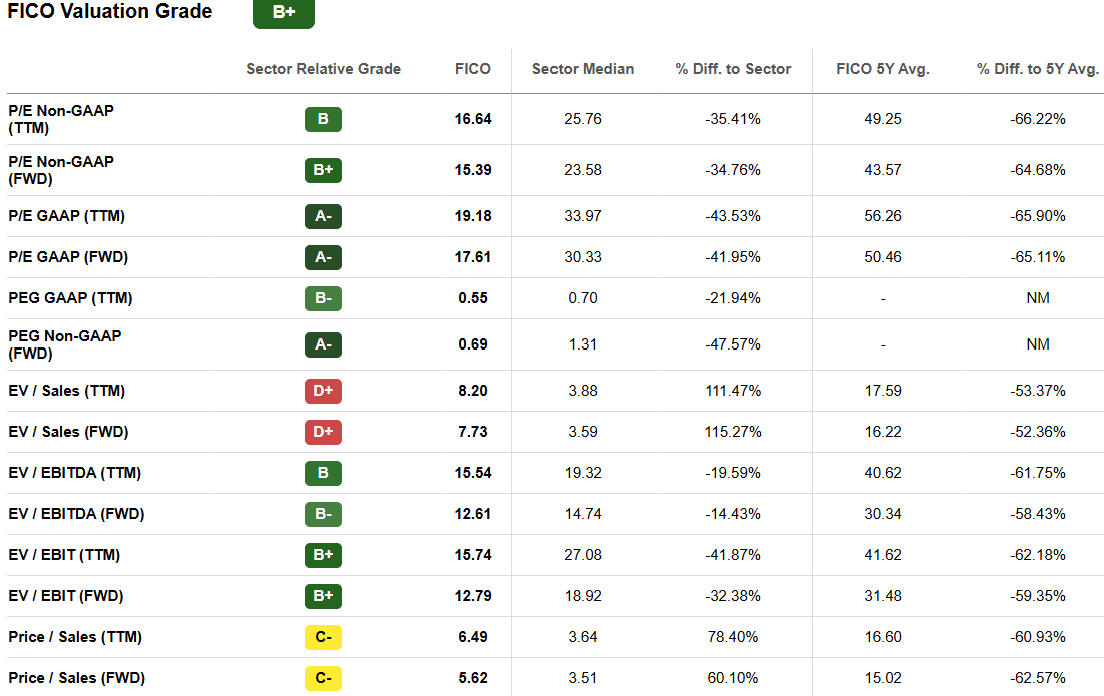
The snapshot compares forward adjusted P/E of 15.39× with a five-year average of 43.57× alongside other valuation methods.
That is a substantial reset. It does not mean the old multiple is the right destination.
Historical valuations tell us what investors once believed about a business. We need to decide whether those beliefs still deserve the same confidence.
FICO’s latest reported quarter illustrates the issue. Revenue increased 26%, with Scores revenue up 41%. Business-to-business Scores revenue grew 49%, driven primarily by higher mortgage-score unit prices.
Software revenue increased 2%, although software annual recurring revenue rose 10%
Those are different growth engines. More usage, new customers and higher prices can all increase revenue. Their durability depends on different conditions.
If customers keep paying more because the product remains essential and difficult to replace, pricing can support excellent economics. If customers gain a workable alternative, further price increases become harder to assume.
The competitive developments therefore matter.
FHFA permits approved Fannie Mae and Freddie Mac lenders to use VantageScore 4.0 for eligible loans. Classic FICO remains eligible. FICO 10T is an approved model, but is not yet eligible for loan delivery under the current policy.
Rocket Mortgage announced on 28 September that it would make VantageScore its preferred model for eligible loans during the fourth quarter. Some products will still use FICO, while its broker channel will offer both.
TransUnion has also extended its advertised 99-cent standalone VantageScore mortgage pricing through the end of 2028.
These announcements do not tell us exactly how much cash flow FICO will lose. They do give customers more practical choice, which makes extrapolating recent mortgage-score price increases less comfortable.
Leverage adds another consideration.
FICO has net debt / EBITDA of approximately 3.7 times trailing and 3.0 times forward.
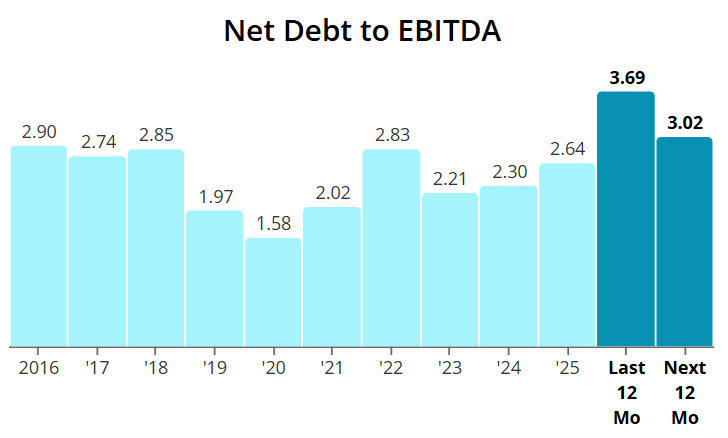
Forward leverage improves if the forecast earnings arrive. The trailing figure is approximately 3.69x.
A forecast of improving leverage is encouraging, provided the earnings and cash flows supporting it remain achievable. If the cash-flow outlook weakens, both the valuation and financial flexibility need reassessing.
The useful takeaway: a low P/E becomes more persuasive when the cash flow behind it is durable.
For FICO, I would watch customer adoption, score pricing, software progress and actual cash generation together. Another share-price decline would change the entry price; it would not answer those operating questions.
This is the central distinction I want to carry into the comparison with SPGI and MSCI: how much growth is the price asking us to believe, and how much confidence does that growth deserve?
Turning the analysis into a decision
Below, paid members get the three original DCF models, the growth assumptions behind them, and a comparison of what happens at 8%, 9% and 10% discount rates.
I then bring the analysis together into one ranked watchlist, specific entry prices and the evidence that would change my view.
This is part of the ongoing paid research alongside the Ranked Opportunity Dashboard, monthly DCF reports and Fair Value Tracker.
Annual membership is £200, equivalent to £16.67 a month billed annually, compared with £25 on the monthly plan.