
The Selloff Just Triggered 3 Buy Signals in My Valuation Model

The market doesn’t ring a bell at the bottom.
It tests your conviction on the way down.
Over the past few weeks, volatility has picked up, headlines have turned negative, and high-quality stocks have quietly slipped into correction territory. Fear spreads faster than fundamentals - and in moments like this, most investors freeze.
But price is not risk.
Overpaying is risk.
Buying without a framework is risk.
Letting emotion drive allocation decisions is risk.
This week, the selloff triggered three buy signals in my valuation model - the same framework I use to determine fair value, downside ranges, and exact buy zones.
I’m not calling a market bottom.
I’m responding to numbers.
In each case, the market is now pricing in growth slowdowns or margin pressure that look materially more pessimistic than the underlying cash flow trends justify. When that gap widens enough, risk/reward flips.
That’s what just happened.
In this article, I’ll break down:
Why the broader market is pulling back
What assumptions are now embedded in prices
The three stocks that just entered my buy zone
And how I’m thinking about risk if the market falls another 10–20%
Free readers get the full thesis and one complete buy signal.
Paid members unlock the full valuation sheets - including exact buy levels, bear/base/bull scenarios, downside probabilities, and how I’m sizing positions in this environment.
Because during a selloff, the real question isn’t:
“Is this the bottom?”
It’s:
Has price finally become worth the risk?
Let’s start with what’s actually driving this pullback.
Market Update
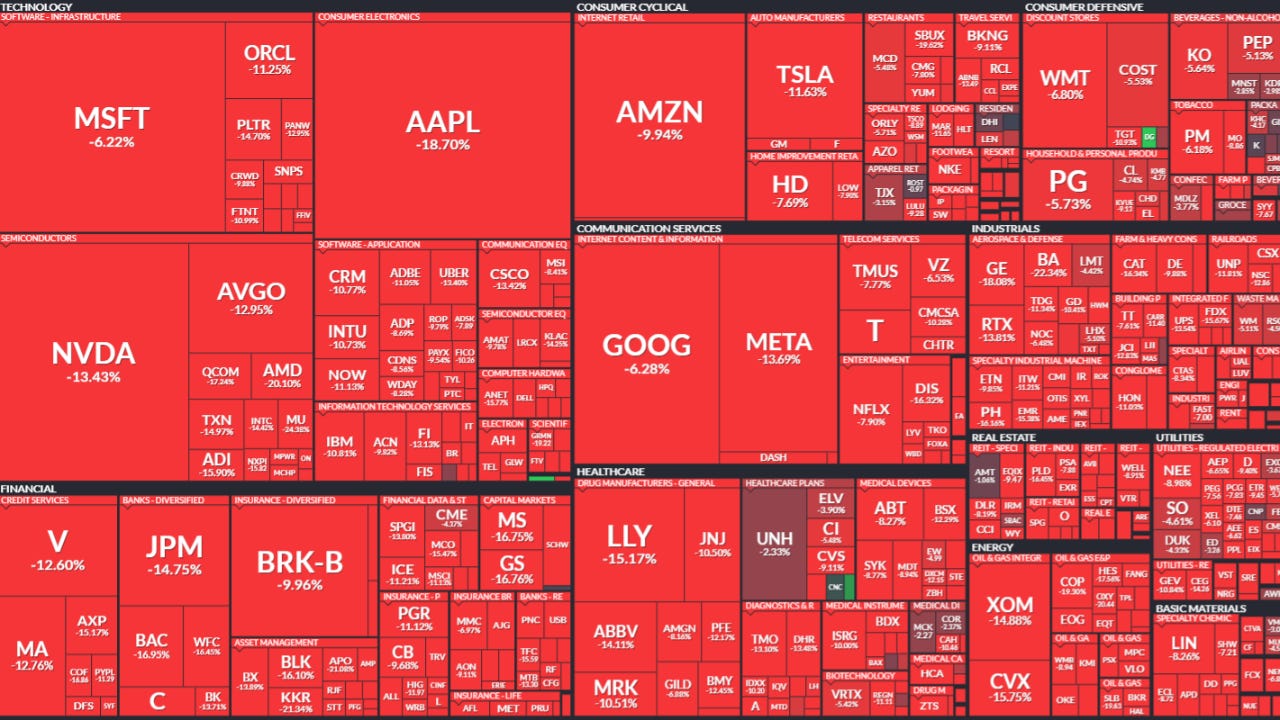
U.S. equities finished the week lower as AI disruption concerns spread beyond technology and into a broader range of industries.
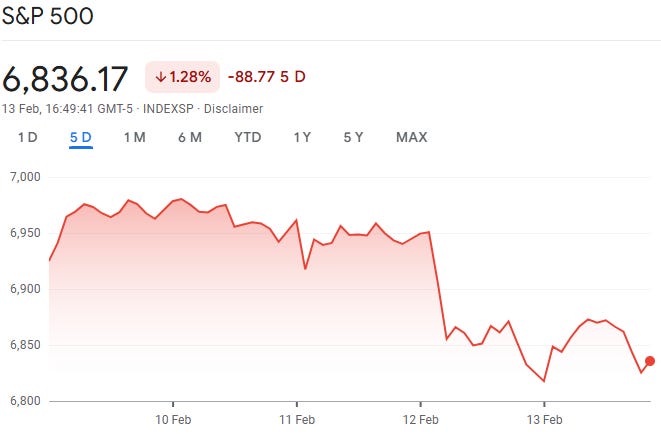
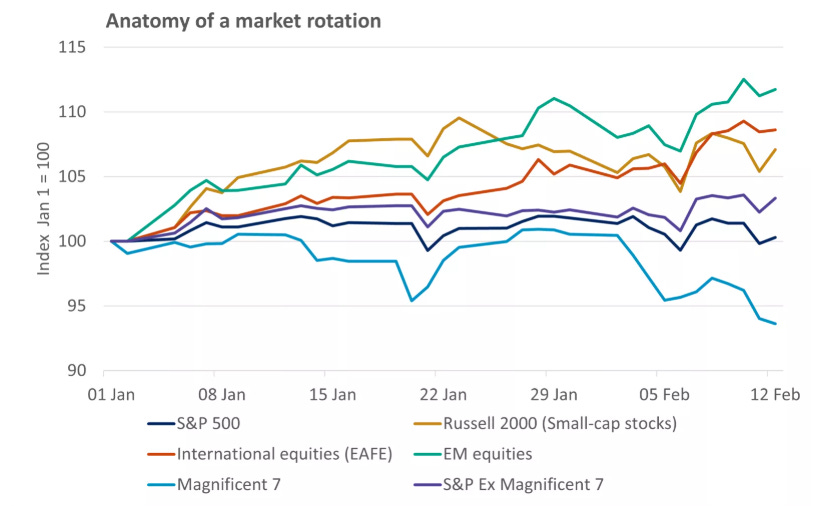
The S&P 500 fell 1.3%, with value outperforming growth for a seventh consecutive week. Leadership is rotating. Concentration risk is being reassessed.
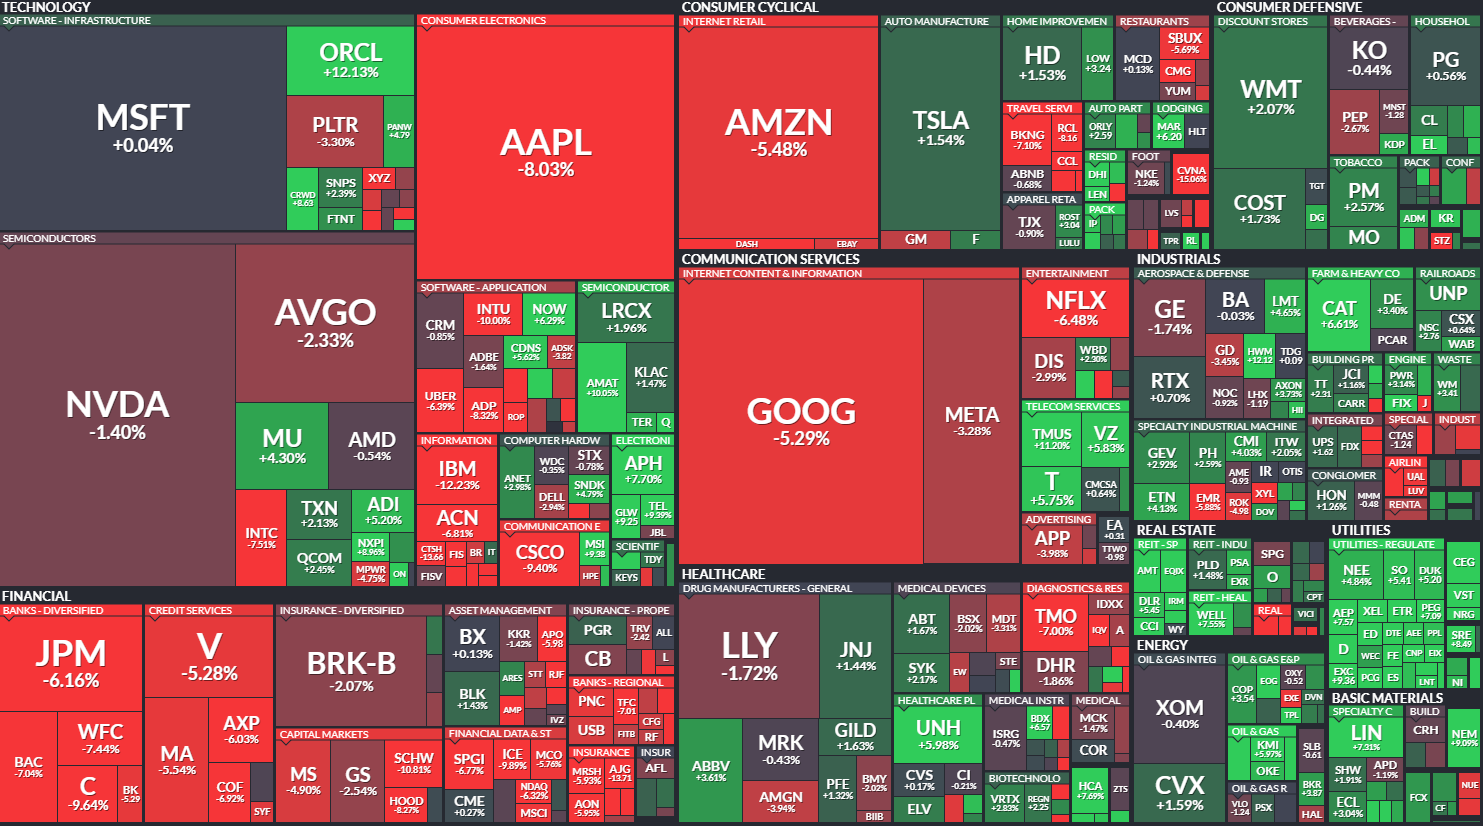
What began as mega-cap weakness is now spilling into financials, insurers, real estate, and logistics names as investors speculate about second-order AI effects.
So far, those fears remain speculative - not reflected in revenues or structural deterioration - but they’ve increased volatility across risk assets. Crypto and precious metals weakened, while capital flowed into Treasuries and defensive sectors.
Labor Market: Still Firm
January’s jobs report came in stronger than expected, with 130,000 jobs added and unemployment ticking down to 4.3%.
The labor market isn’t breaking.
That pushed rate-cut expectations further out, with markets now pricing a higher probability that the Fed holds steady through mid-year.
Inflation cooled modestly, though core readings remain sticky enough to keep policy cautious.
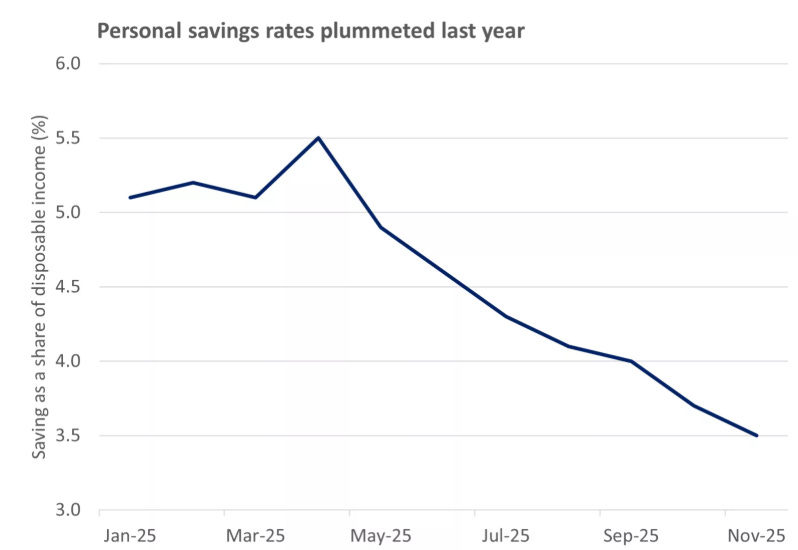
Consumers Normalize
Retail sales stalled, and control group sales dipped slightly.
After a period where spending outpaced income growth, moderation isn’t surprising. It suggests normalization - not contraction.
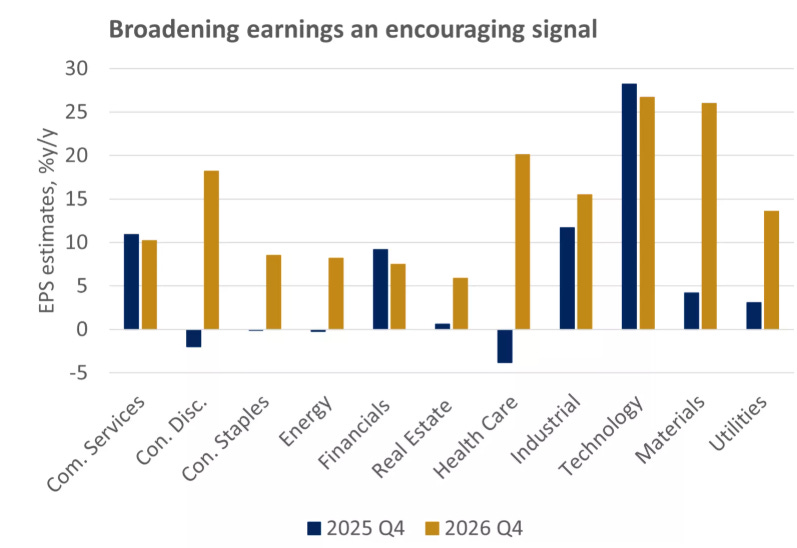
The Bigger Picture
Fundamentals remain constructive.
Corporate earnings have been broadly solid, and the macro backdrop - steady growth, resilient profits, eventual policy easing - remains intact.
But markets are no longer pricing a straight-line expansion.
Volatility is rising. Rotations are accelerating. Valuation dispersion is widening.
And that environment rewards discipline.
What Triggers a Buy Signal in My Model
I don’t buy simply because a stock is down.
Price weakness alone isn’t opportunity - it’s volatility.
A buy signal requires multiple conditions to align:
1️⃣ Defined Margin of Safety
The stock must trade meaningfully below my conservative fair value range - typically at least 20% under intrinsic value based on normalized cash flow assumptions.
2️⃣ Multiple Compression vs History
The forward P/E must sit below its 5-year average. When high-quality businesses trade at discounts to their own history during temporary uncertainty, sentiment often overshoots.
3️⃣ Mispriced Growth Expectations
The market must be embedding assumptions more pessimistic than long-term cash flow trends justify.
4️⃣ Risk-Adjusted Return Above Hurdle Rate
Modeled forward returns must compensate for macro and volatility risk.
5️⃣ No Structural Impairment
Temporary slowdowns are acceptable. Competitive moat erosion is not.
When those conditions line up, volatility becomes opportunity.
This week, three high-quality companies crossed that threshold.
Let’s start with the first.
1. Mastercard (MA)
The selloff hasn’t spared quality.
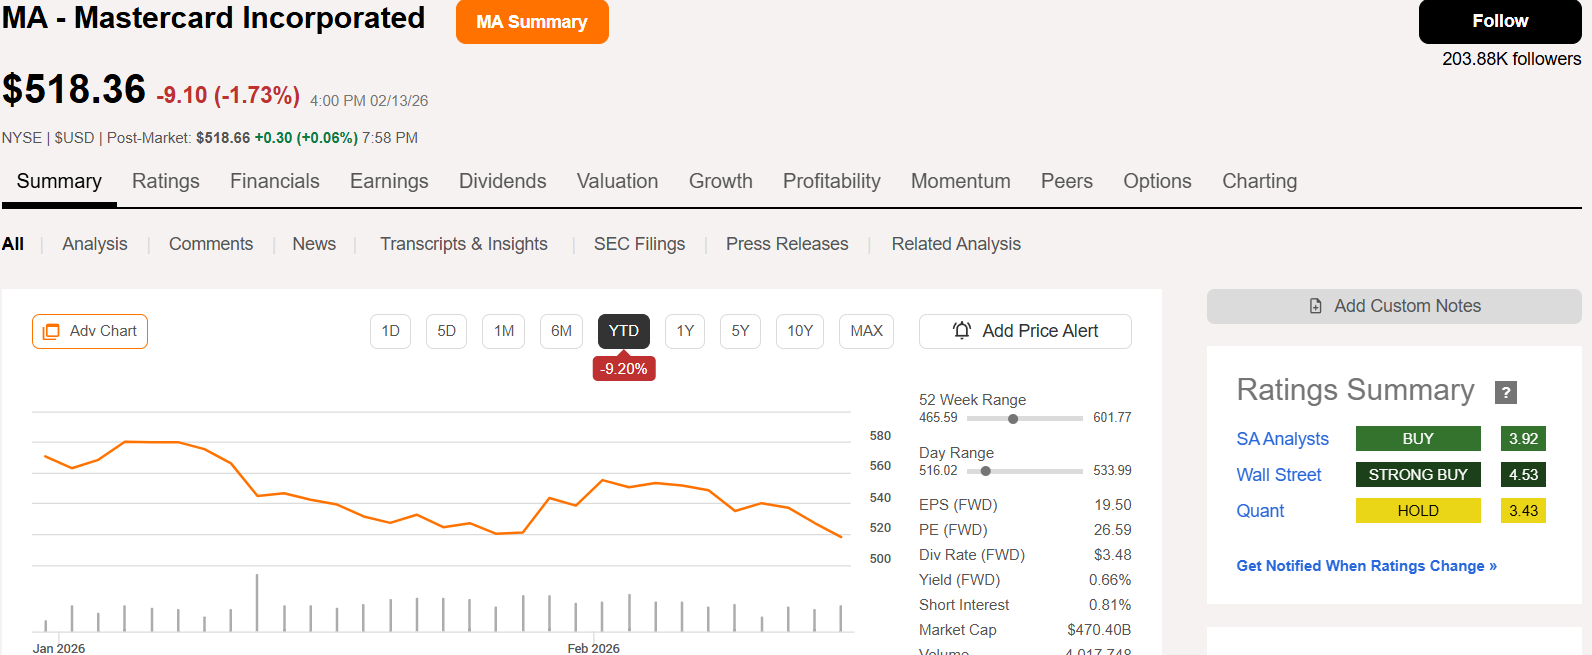
Even businesses with durable competitive advantages and consistent cash flow growth have seen their multiples compress. Mastercard is one of them.
Shares have pulled back as investors price in slowing consumer activity and moderating cross-border volumes.
But when you step back, the long-term thesis hasn’t changed.
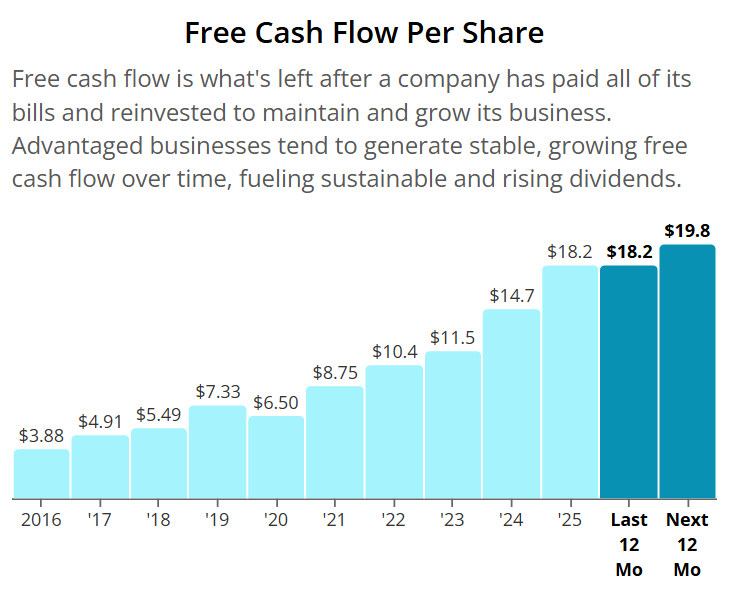
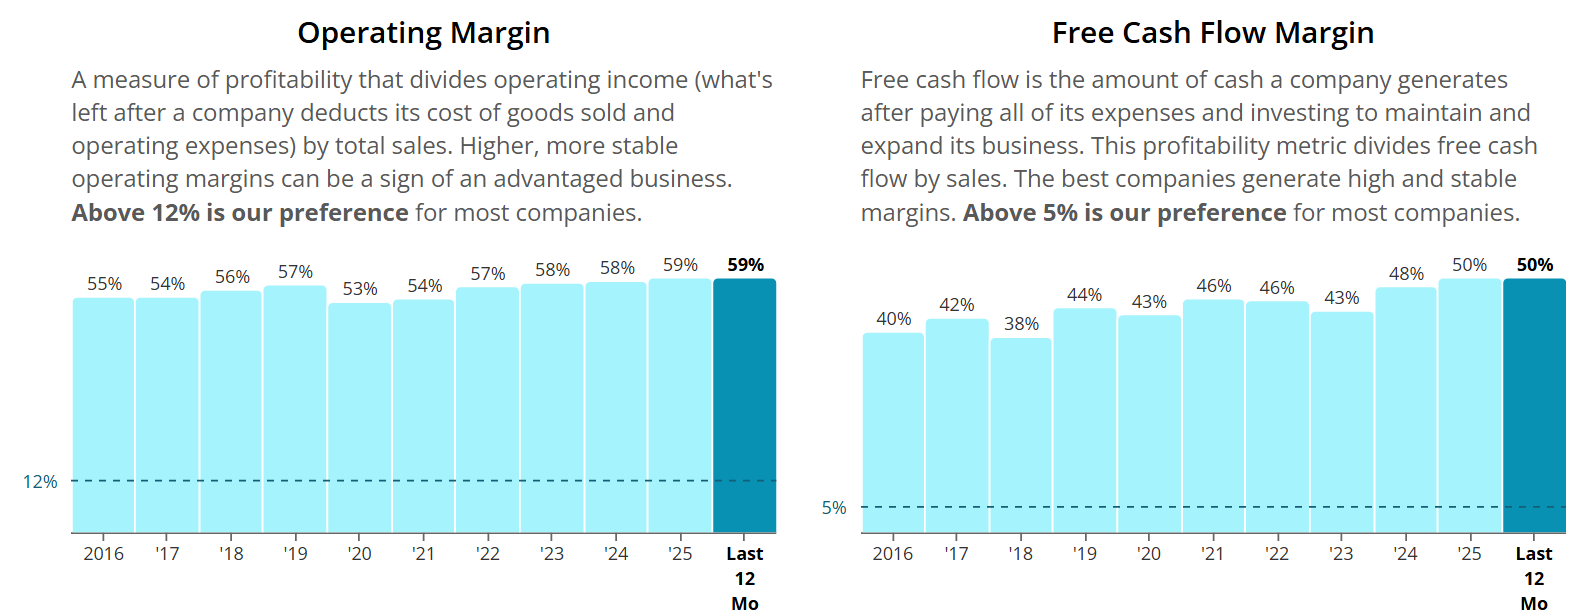
Mastercard remains one of the most asset-light, high-return businesses in the market. Operating margins remain strong. Free cash flow conversion is consistent. The secular shift toward digital payments continues globally.
What’s changed isn’t the business.
It’s the valuation.
The forward P/E now trades below its 5-year average, reflecting a reset in expectations. Historically, periods of multiple compression during macro uncertainty - while cash flow continues compounding - have offered attractive forward returns.
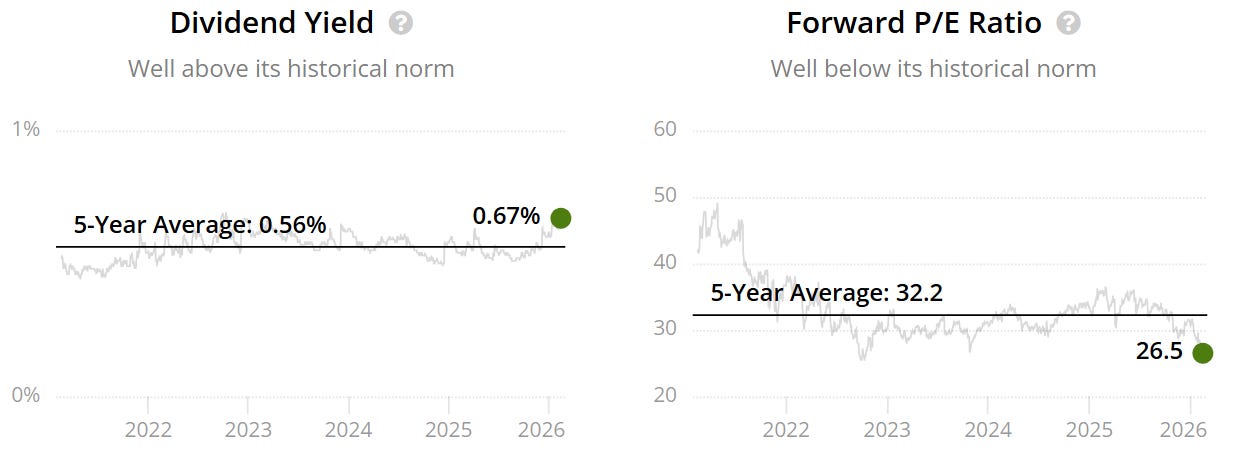
Under normalized assumptions, shares now trade at a discount to intrinsic value that exceeds my required margin of safety.
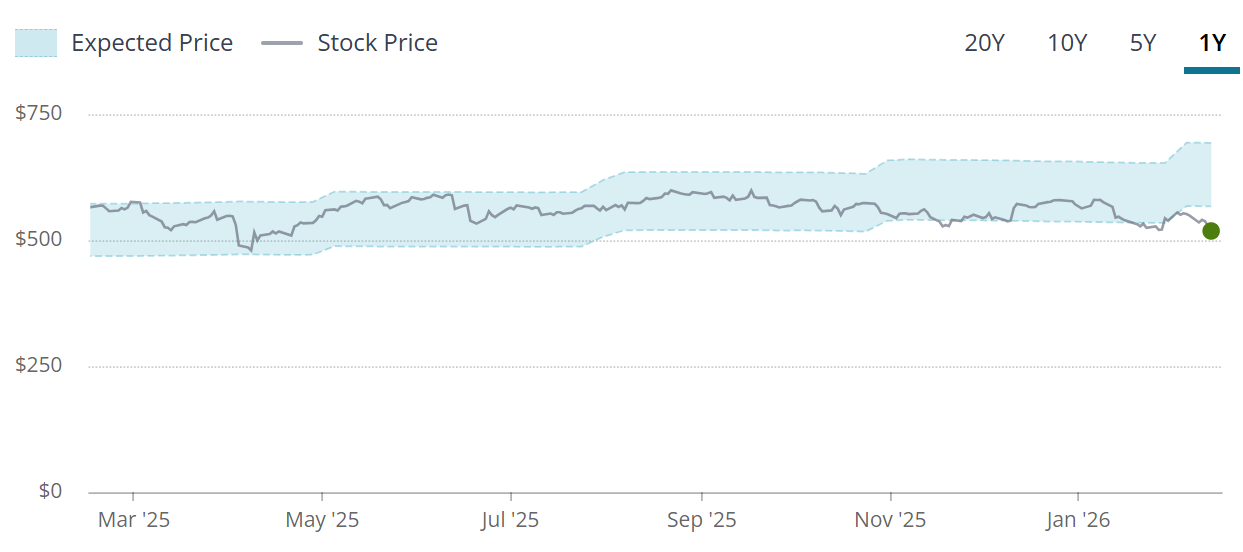
Model Status: BUY Signal Triggered
Mastercard was the first signal - a high-quality compounder trading below its historical valuation range.
The next two buy signals are more asymmetric.
One is a mega-cap platform where operating leverage is improving while the market prices in deterioration.
The other is generating record free cash flow while sentiment remains anchored to prior growth scares.
Both show wider modeled upside than Mastercard - with higher volatility.
The full DCF breakdown - including growth assumptions, discount rates, and bear/base/bull valuation ranges - is available below for paid members.