
These 3 Mega-Cap Growth Stocks Are Quietly 20%–35% Off Their Highs
Three market leaders are in rare pullbacks. I break down what’s changed and whether the risk/reward is finally improving.

Paid members get exclusive tools and insights to turn market research into actionable opportunities.
Undervalued dividend stocks - monthly spreadsheet highlighting high-quality income opportunities. (Released 1st of every month)
High-upside S&P 500 ideas - track market leaders poised to rebound or outperform. (Released 15th of every month)
Exclusive analysis & watchlists - curated to complement articles like this one.
Access these insights and spreadsheets instantly - available only to paid members.
Market Update
Last week reminded investors just how quickly the market’s mood can shift. A fresh round of geopolitical noise hit headlines after President Trump threatened new tariffs on several European trade partners, briefly reigniting fears of a broader trade dispute. The episode proved short-lived, however, and markets soon pivoted back to what really moves prices: economic data and corporate earnings.
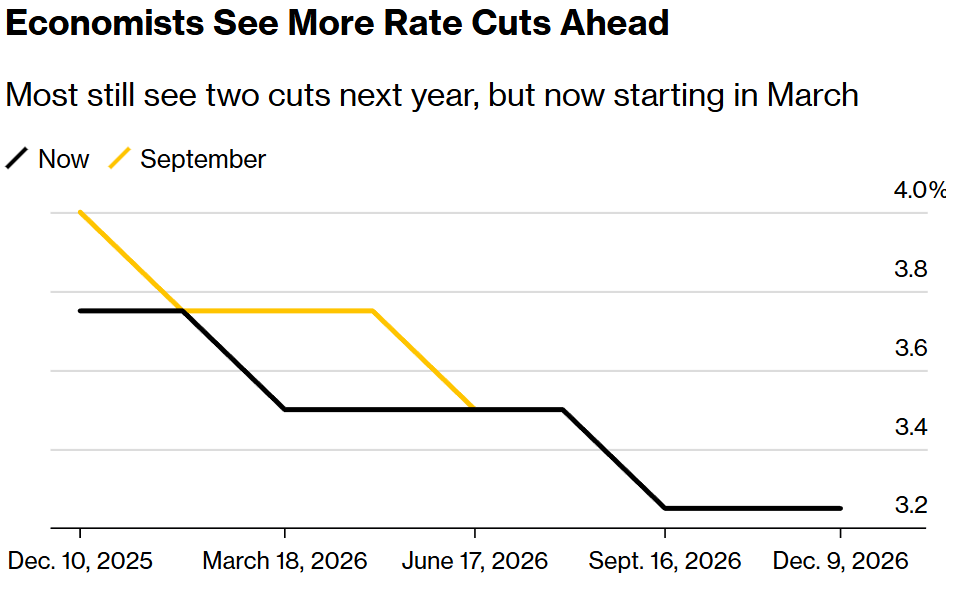
That focus will only intensify in the days ahead. This week’s Federal Reserve meeting takes center stage, with policymakers widely expected to hold rates steady for now - while leaving the door open to additional cuts later this year.
At the same time, a heavy slate of earnings will offer a fresh read on corporate health, including whether AI-related leaders can maintain their momentum and whether profit growth is finally spreading more evenly across the broader economy.
If growth continues to firm, inflation gradually cools, and interest rates trend lower, the backdrop could support a broadening of market leadership in 2026 - strengthening the case for staying diversified rather than relying on a narrow group of winners.
Stocks Whipsaw on Tariff Headlines
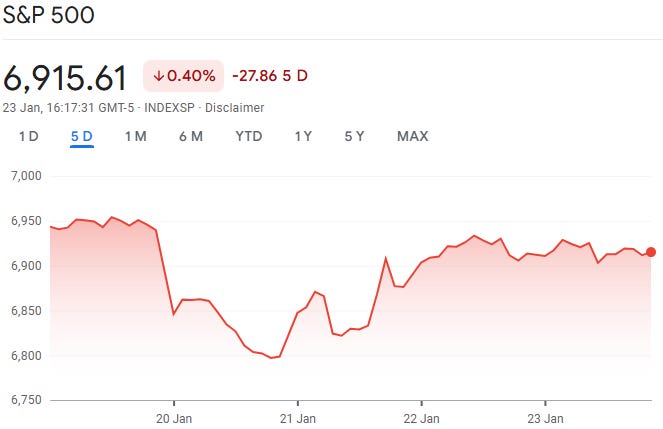
Major U.S. stock indexes ended a volatile, holiday-shortened week modestly lower with the S&P 500 down 0.40%.
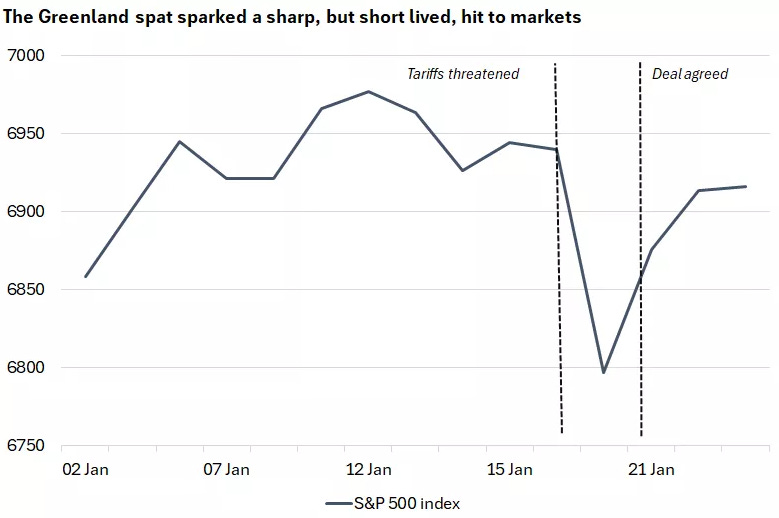
Markets stumbled out of the gate Tuesday, with the S&P 500 posting its sharpest one-day drop since October. The selloff followed renewed trade-war concerns after President Trump announced plans to impose new tariffs on European nations opposing U.S. efforts to purchase or take control of Greenland.
The tone shifted quickly. On Wednesday, stocks rebounded after Trump appeared to walk back the threat, posting on social media that he and NATO Secretary General Mark Rutte had “formed the framework of a future deal” regarding Greenland and that the scheduled February 1 tariffs would no longer move forward. The clarification sparked a relief rally, allowing major indexes to recover from their worst levels by week’s end.

GDP Revised Higher, Inflation Still Sticky
On the economic front, revised data showed the U.S. economy ended the third quarter on firmer footing than previously thought. The Bureau of Economic Analysis reported that real GDP grew at a 4.4% annual rate, slightly above the prior 4.3% estimate and stronger than the second quarter’s 3.8% pace. Higher exports and business investment drove much of the upward revision.

Inflation, however, remains elevated. The Fed’s preferred gauge - the core personal consumption expenditures (PCE) price index - rose 0.2% in November, matching October’s increase. On a year-over-year basis, core PCE climbed 2.8%, still meaningfully above the Federal Reserve’s 2% target.

Labor Market Holds Firm; Consumers Slightly More Upbeat
Employment data continued to point to a labor market that is cooling only gradually. Initial jobless claims for the week ended January 17 rose modestly to 200,000, but remained below expectations and near multi-year lows. The four-week moving average fell to 201,500, the lowest level in two years, while continuing claims edged down to 1.849 million.

Consumer sentiment showed some improvement as well. The University of Michigan’s final January reading rose to 56.4, up from 52.9 in December. Even so, confidence remains more than 20% lower than a year ago, with consumers still citing high prices and concerns about a weakening labor market as key pressures on household finances.

Last Weeks Winners & Losers
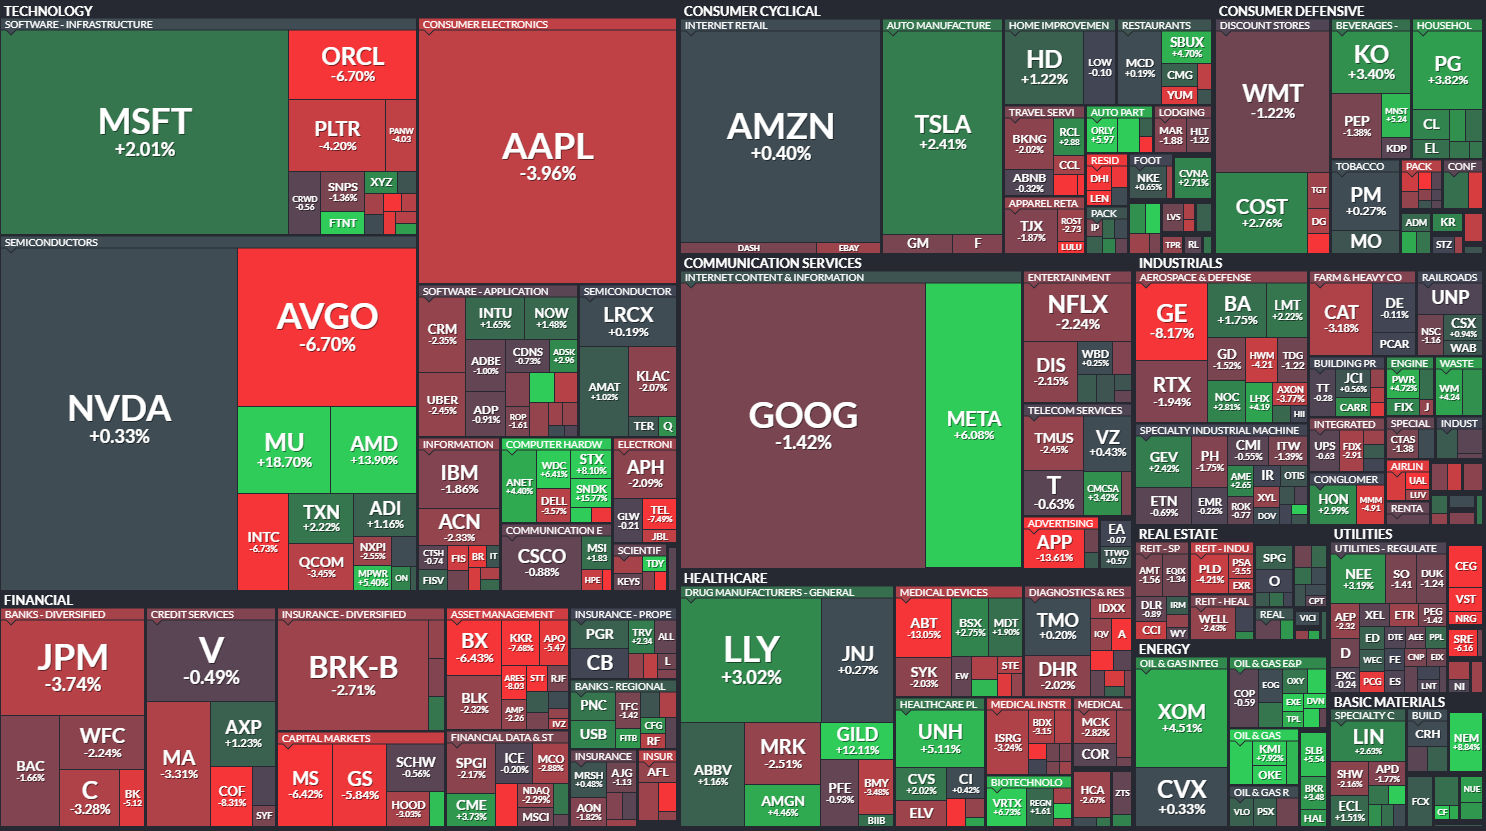
Top performers:
Micron (+19%)
SanDisk (+16%)
AMD (+14%)
Gilead Sciences (+12%)
Fortinet (+7%)
Biggest drops:
Constellation Energy (-15%)
Applovin(-14%)
Abbott Laboratories (-13%)
GE Aerospace (-8%)
Broadcom (-7%)
Oracle (-7%)
Notable News
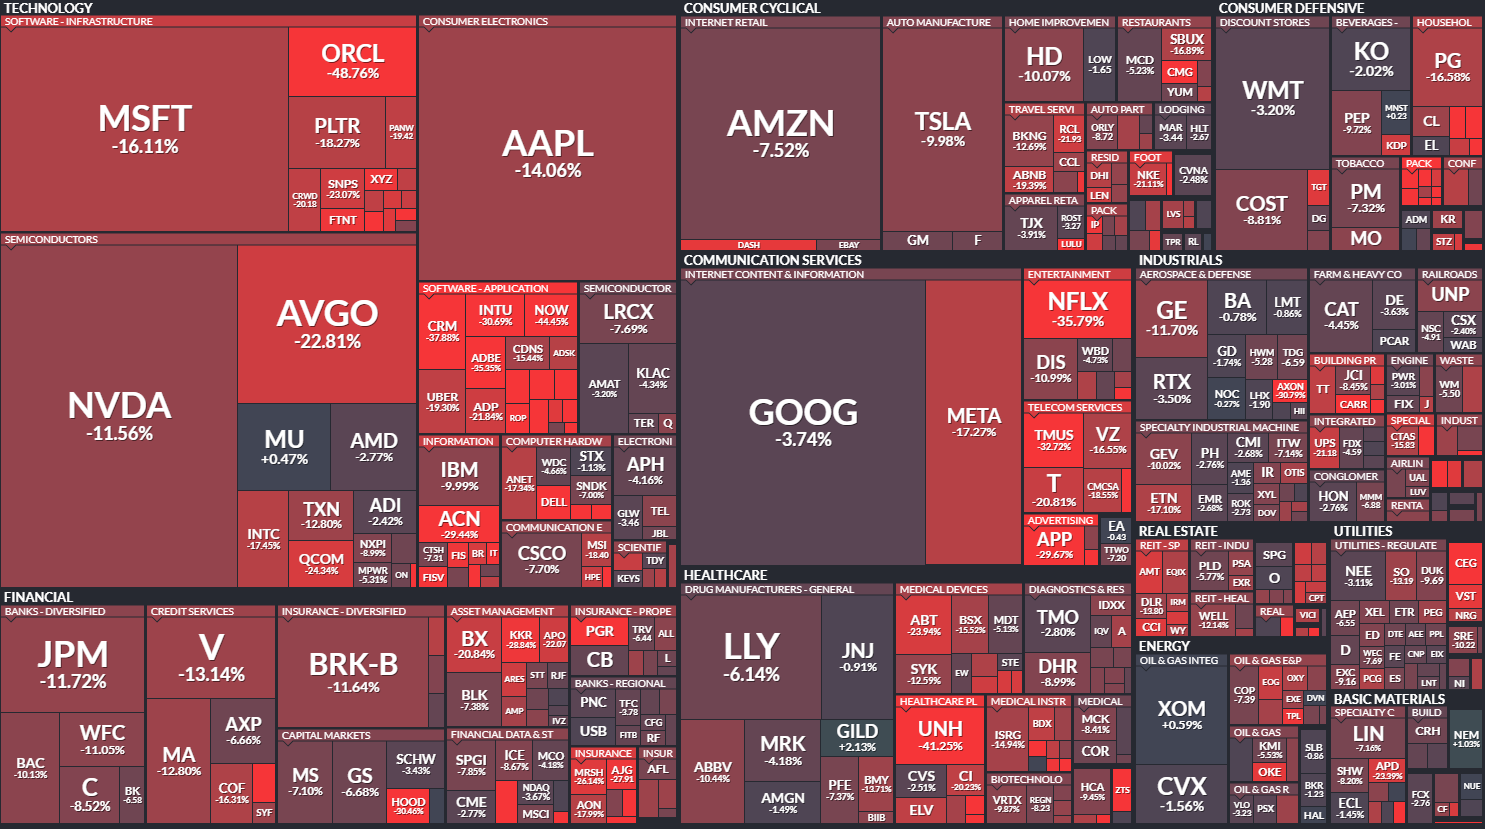
While major indexes remain near their highs, a growing number of individual stocks are telling a very different story. Across multiple sectors, many well-known names are now trading 30% to 70% below their 52-week highs - a reminder that beneath the surface, this has been a far more uneven market than headline index levels might suggest.
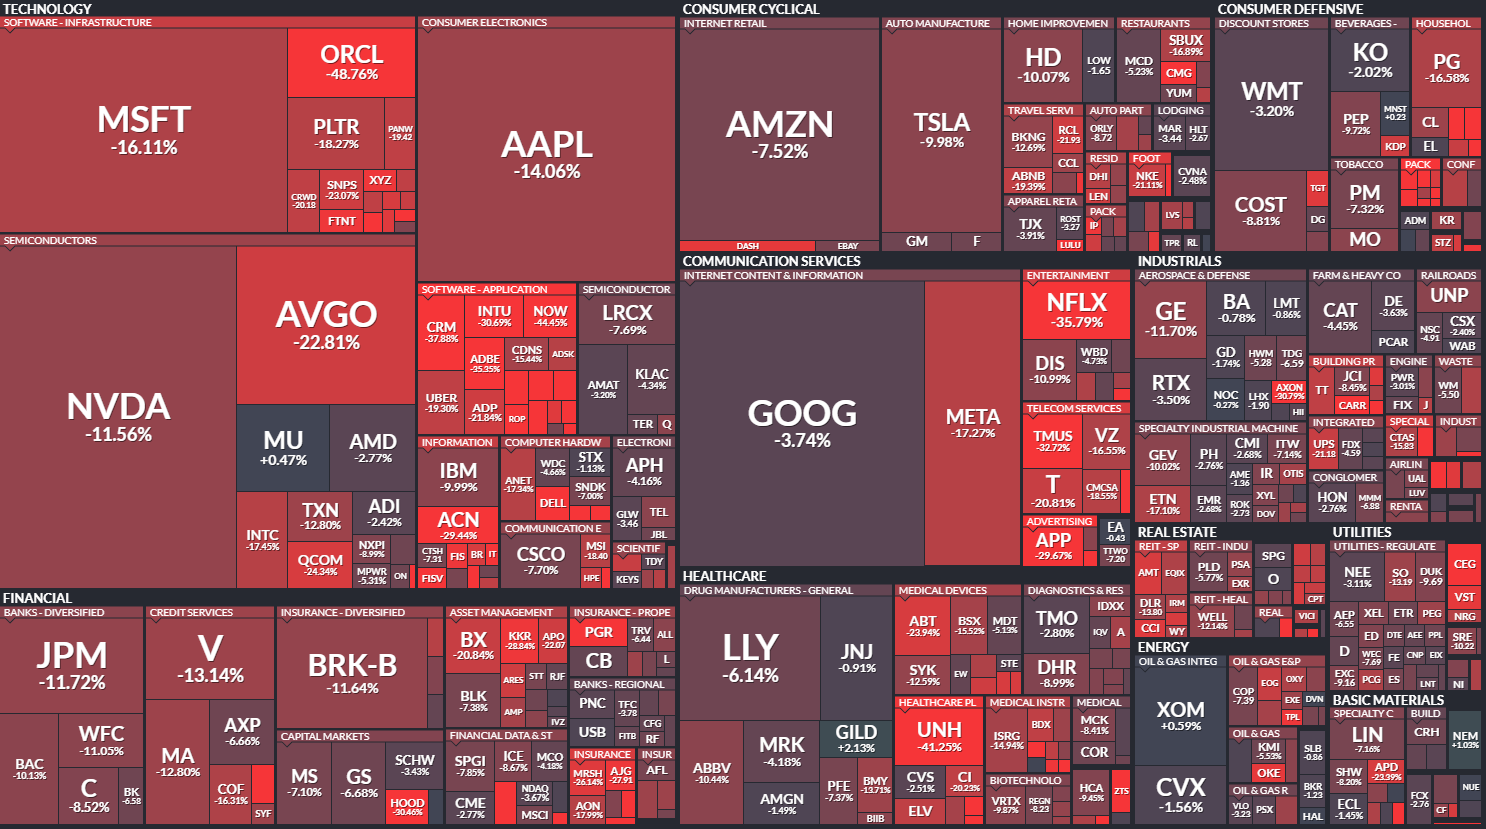
That disconnect is creating both risk and opportunity. In some cases, sharp pullbacks reflect real business challenges. In others, they may be driven more by shifting sentiment, profit-taking, or broader rotations out of last year’s winners.
To dig into this, I recently put together a YouTube video walking through a group of these beaten-down stocks, breaking down what’s changed, where valuations now stand, and whether any of them look compelling from a risk/reward standpoint. If you’re interested in finding potential opportunities away from the crowded trades, you can check out the full breakdown here.
Earnings Week

Join 119,000+ investors on YouTube! 🎥
We break down earnings, market moves, and exclusive insights you won’t find anywhere else.
Don’t miss out — hit the button below to watch and subscribe now! 👇
YouTube Channel 🔔
Subscribe today and stay ahead of the market!
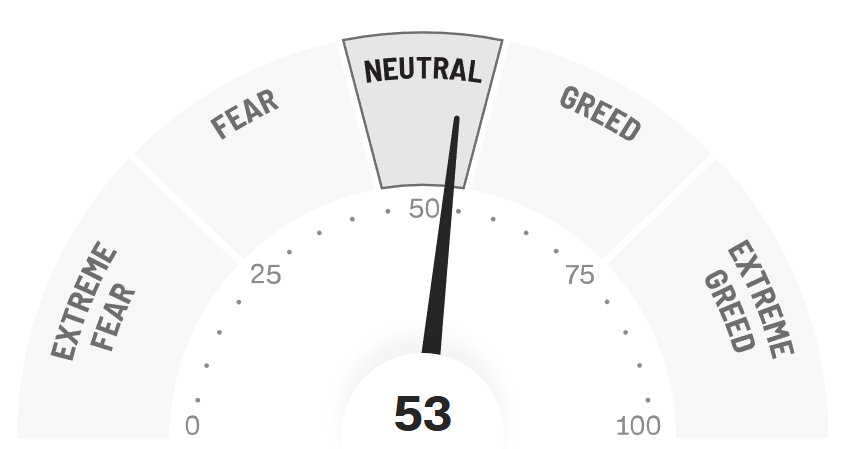
Fear & Greed Index
3 Beaten Down Growth Stocks
While the major indexes remain near their highs, the reality for many individual stocks looks very different. Beneath the surface, a growing number of high-quality growth names have gone through meaningful pullbacks, even as broader market sentiment appears relatively calm.
In this section, I’m taking a closer look at three large, well-known growth stocks that are now trading 20% to 35% below their recent highs. The goal isn’t to call a bottom - but to understand what’s changed, how expectations have reset, and whether the current setup is starting to offer a more attractive risk/reward for long-term investors.
1. Broadcom (AVGO)
So… What Is Broadcom Really - and How Does It Actually Make Money?
At first glance, Broadcom can look like “just another semiconductor company.” In reality, it’s much closer to a critical infrastructure provider for the modern digital economy - with a business model that’s far more diversified and durable than many investors realize.
Broadcom makes money in two main ways.
The first is its core semiconductor business, which designs and supplies specialized chips used in data centers, networking equipment, broadband, and wireless devices. These aren’t consumer gadgets - they’re the behind-the-scenes components that help move massive amounts of data through the internet, cloud platforms, and enterprise networks. As AI workloads grow and data traffic continues to explode, Broadcom’s networking and custom silicon products have become increasingly strategic for hyperscalers and large enterprises.

The second - and often underappreciated - pillar is software. Through a series of acquisitions, Broadcom has built a large enterprise software business that includes infrastructure software, cybersecurity, and mainframe-related tools. These products tend to be deeply embedded in customers’ IT environments, leading to sticky, recurring revenue and strong pricing power over time.
What makes Broadcom’s model especially compelling is the mix of growth and cash generation. The semiconductor side gives it exposure to long-term themes like cloud, networking, and AI. The software side provides more stable, subscription-like cash flows that help smooth out the inherent cyclicality of the chip business.
The result is a company that behaves less like a pure-play chip stock and more like a hybrid of a high-performance semiconductor supplier and a recurring-revenue enterprise software provider - a combination that has historically supported strong margins, robust free cash flow, and an aggressive capital return strategy.
Why Broadcom Has Been Stuck - Even After a Strong Quarter
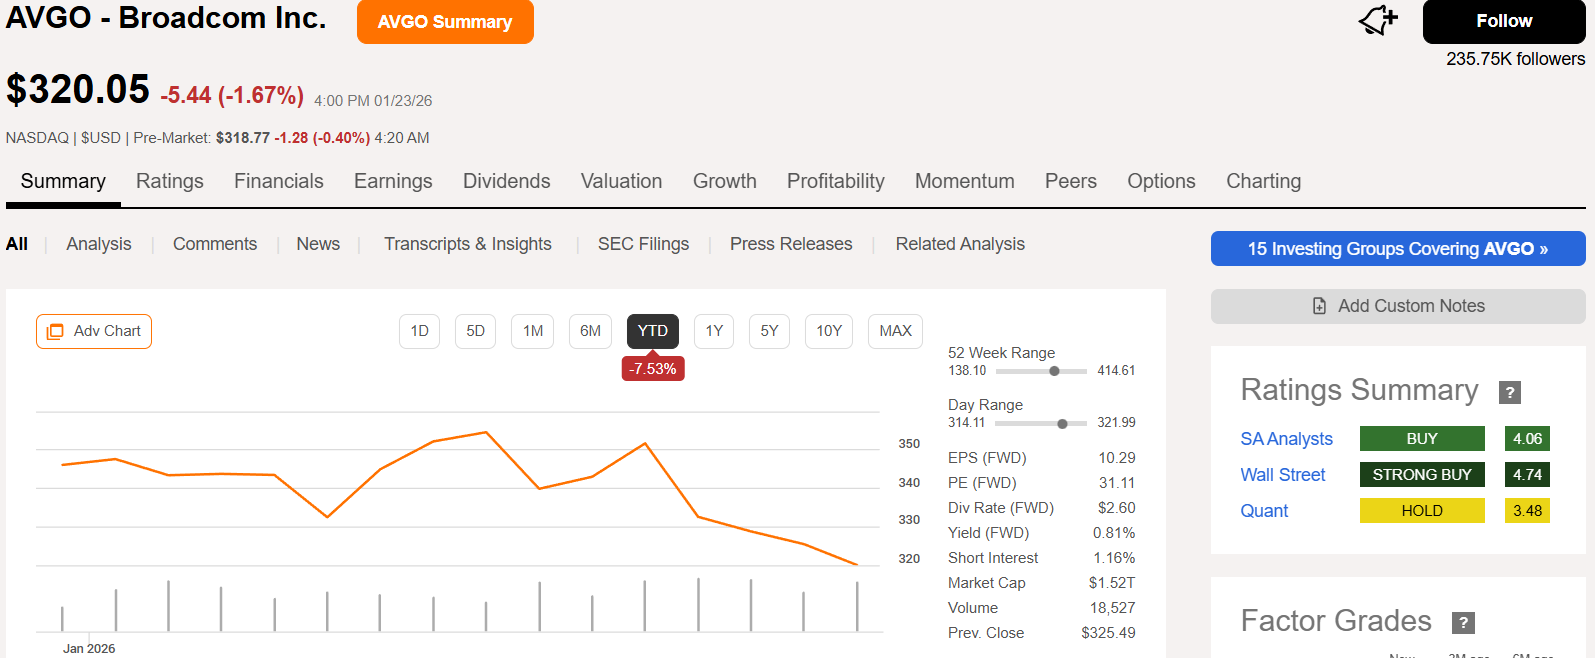
On the surface, Broadcom’s latest earnings report looked exactly like what investors should want to see. The company delivered strong fourth-quarter results, with revenue jumping 28% year over year to roughly $18.0 billion and adjusted earnings beating expectations. AI-related semiconductor revenue surged 74%, and management guided to another strong quarter ahead, forecasting approximately $19.1 billion in revenue for Q1 fiscal 2026.

And yet, despite all of that, the stock moved lower.
The disconnect comes down to expectations - and how the market is now viewing the next phase of the AI buildout.
First, while Broadcom’s AI business is growing rapidly, it is also becoming a larger share of overall revenue - and those products tend to carry lower gross margins than some of Broadcom’s legacy businesses. Management acknowledged that the mix shift toward AI is expected to pressure consolidated margins, with gross margin projected to decline by roughly 100 basis points in the near term. For a stock that had already rerated higher on the AI narrative, that margin commentary mattered.

Second, even impressive guidance wasn’t enough to clear a very high bar. Broadcom disclosed an AI order backlog of approximately $73 billion to be delivered over the next 18 months. While that is a massive figure in absolute terms, some investors were hoping for even stronger visibility or more aggressive long-term revenue targets. The lack of detailed 2026 AI revenue guidance left the market wanting more, especially given how much optimism was already priced into the stock.
Finally, there is a broader “sell-the-news” dynamic at work across AI and infrastructure names. After a long stretch where strong AI exposure alone was enough to drive multiples higher, investors are increasingly focused on profitability, customer concentration, and the sustainability of returns on massive data center spending. In that environment, even a strong quarter can trigger profit-taking if the forward narrative doesn’t meaningfully exceed expectations.
In short, Broadcom didn’t disappoint on fundamentals - but it also didn’t decisively raise the ceiling on what investors believe the next phase of AI-driven growth will look like. For now, that’s been enough to keep the stock range-bound, even as the underlying business continues to execute well.
Why Now May Be a Compelling Entry Point
When a high-quality compounder pulls back, the most important question isn’t what the stock has done - it’s what the business has done. And on that front, Broadcom’s long-term operating performance tells a very different story than the recent share price action.
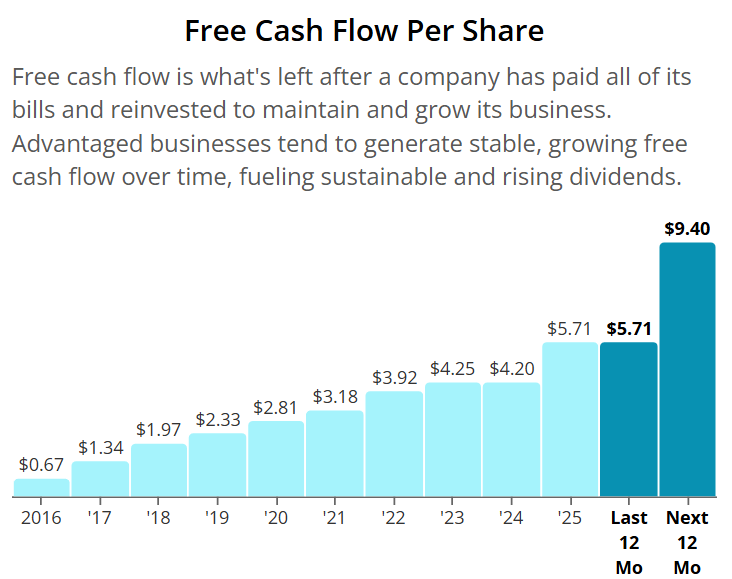
Over the past decade, Broadcom has quietly delivered extraordinary free cash flow growth. In 2016, the company generated roughly $0.67 in free cash flow per share. By 2025, that figure has climbed to approximately $5.71 - more than an 8x increase. That kind of cash flow compounding is the foundation of long-term shareholder returns, and it reflects both scale and sustained operating leverage.
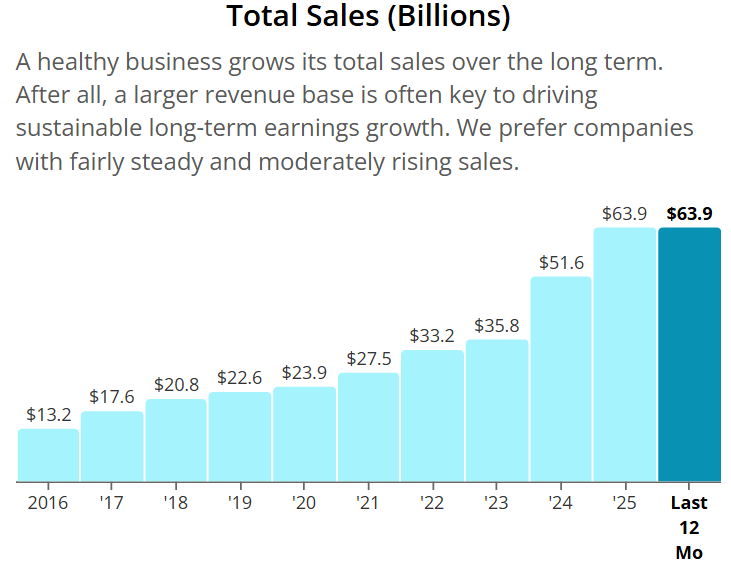
Revenue growth has been just as striking. Annual sales have expanded from around $13 billion in 2016 to roughly $64 billion today. That growth hasn’t come at the expense of profitability - in fact, quite the opposite.
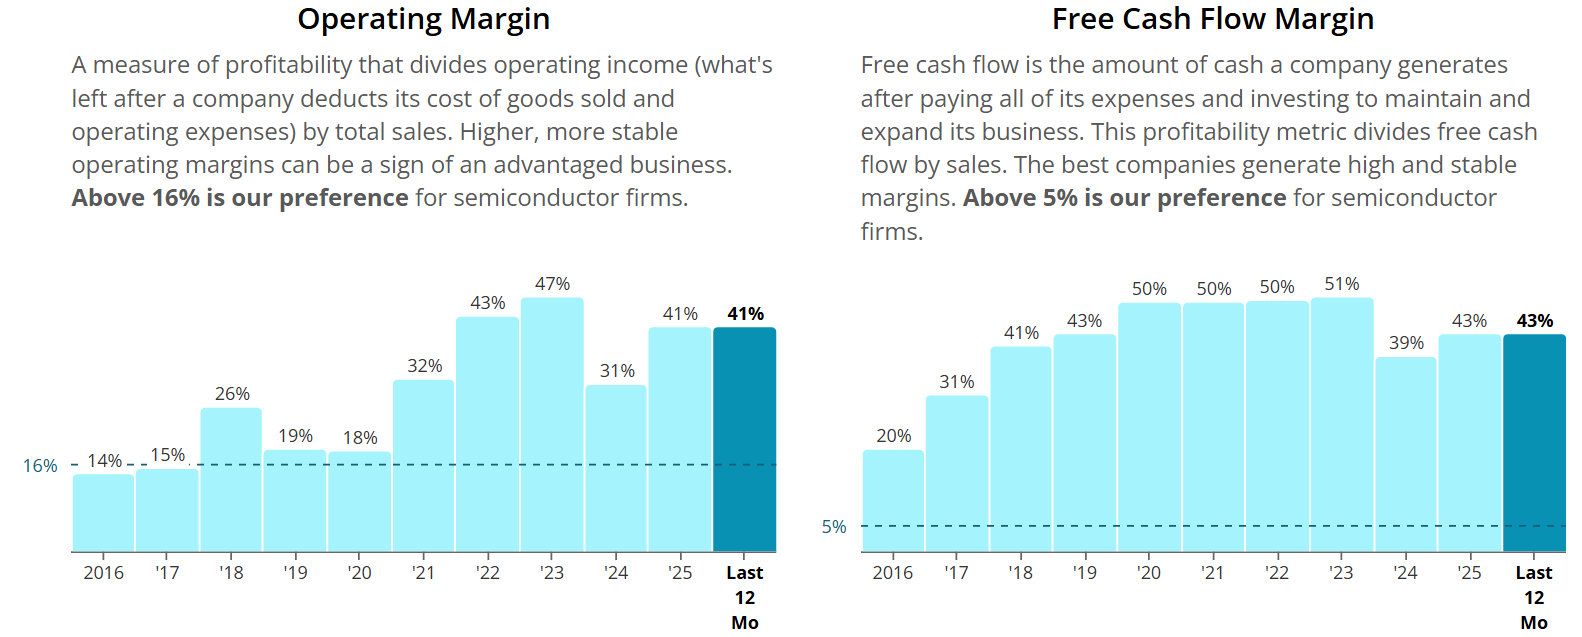
Operating margins have expanded dramatically, rising from about 14% to approximately 41%. At the same time, free cash flow margins have more than doubled, moving from around 20% to roughly 43%. That combination - strong top-line growth alongside expanding margins - is the hallmark of a business that is increasing its pricing power, efficiency, and strategic importance to customers.
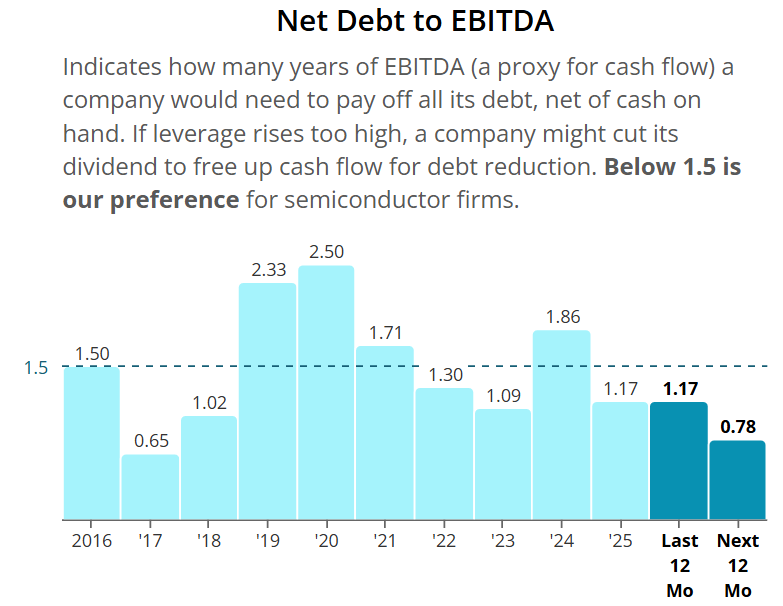
Balance sheet strength adds another layer of flexibility. Net debt to EBITDA currently sits at approximately 1.17x, giving Broadcom ample room to continue investing, pursuing bolt-on acquisitions, and returning capital to shareholders without taking on excessive financial risk.
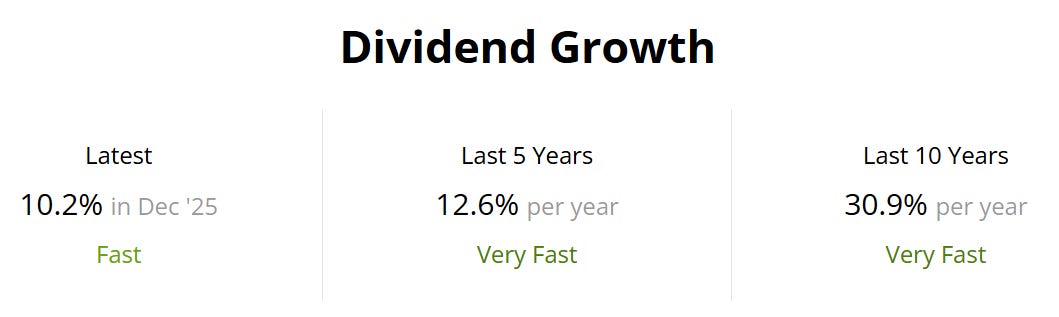
And shareholders have been direct beneficiaries of this cash flow engine. Broadcom’s dividend has compounded at an extraordinary 31% annual rate over the past 10 years, reflecting both management’s confidence in cash generation and the durability of the underlying business model.
Put together, the picture is clear: while the stock has been stuck, the business has continued to compound at a high level. With free cash flow, margins, and balance sheet metrics all near historical highs, the recent pullback may be offering investors a chance to buy a structurally stronger company at a more reasonable valuation - rather than a business in decline.
Valuation
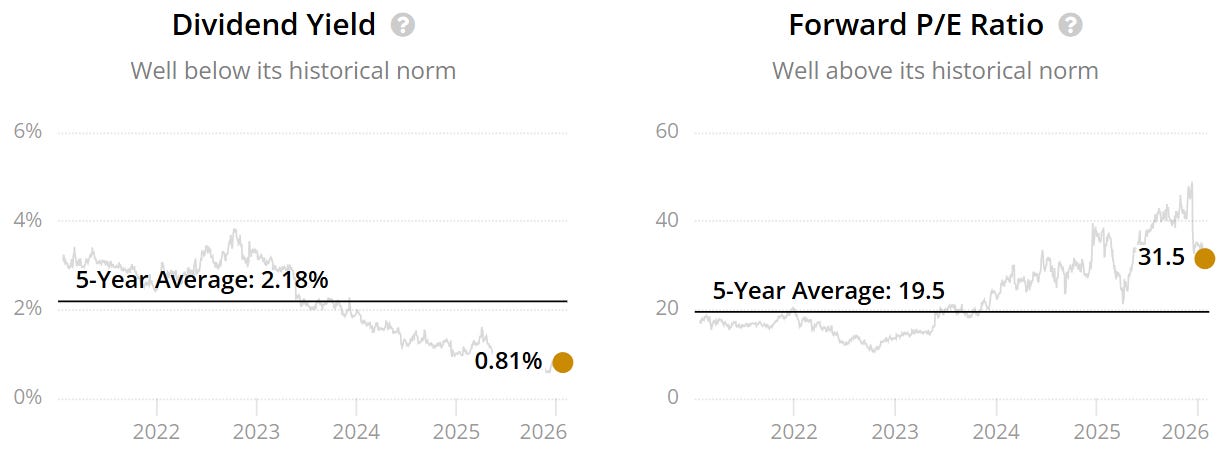
The forward P/E sits above the 5Y average - 31.5x v 19.5x. This could indicate the company is potentially overvalued.
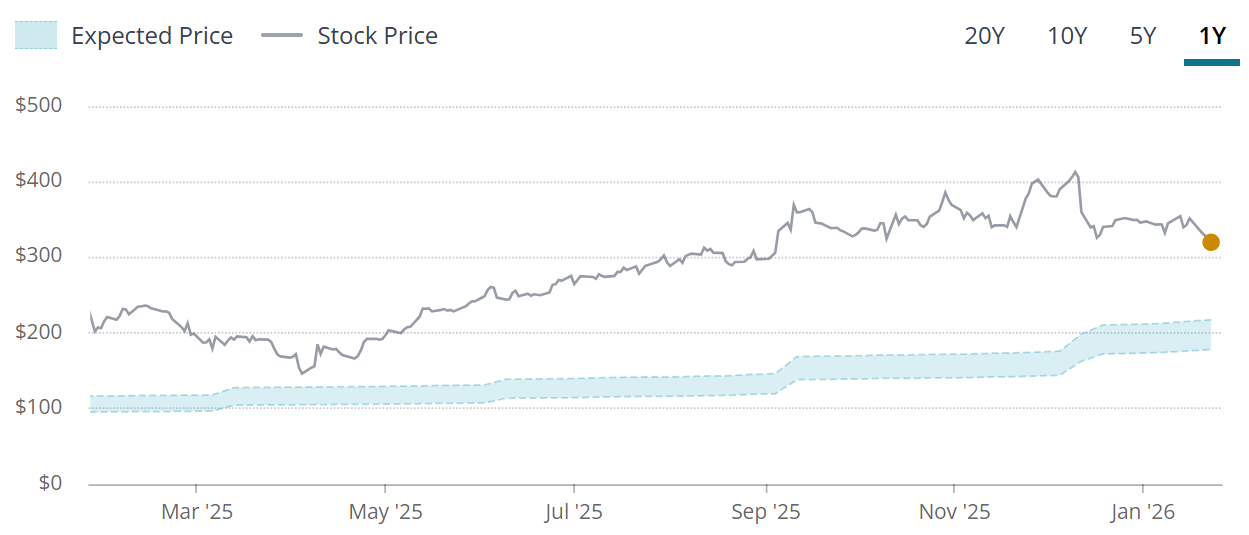
The blue tunnel highlights that the company is significantly above the upper end of the fair value boundary indicating a potential overvaluation signal.
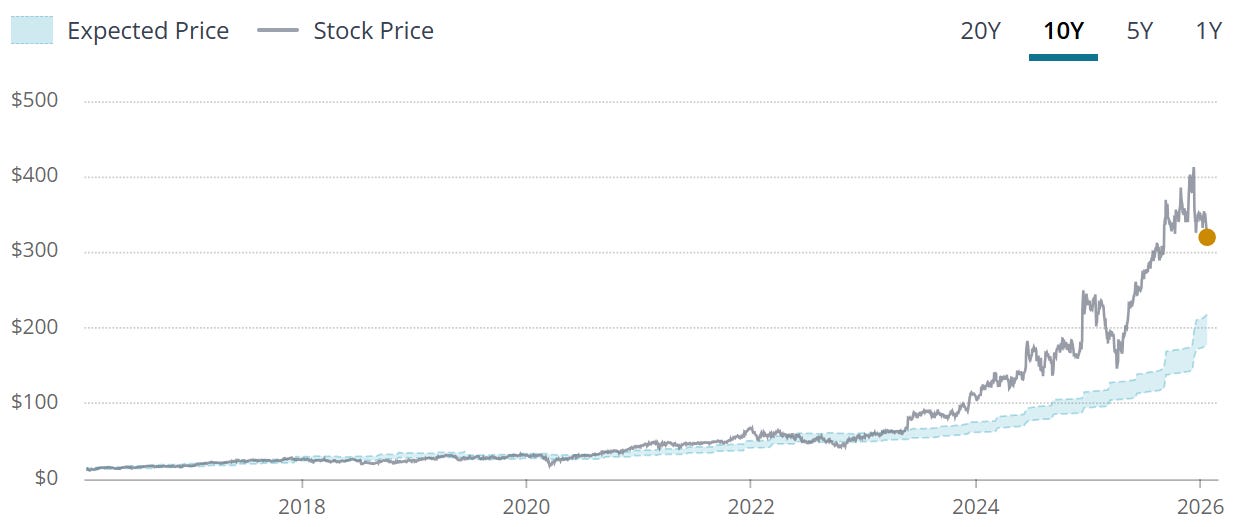
When we zoom out to the last 10Y we can see that Broadcom has been trading in the overvalued level since 2023. So investors have been happy to pay a premium over the last 3 years, however note that prior to this, this was not the case.
DCF Model