
2 Beaten Down Semiconductors To Buy Now!
+Market Update


Market Latest
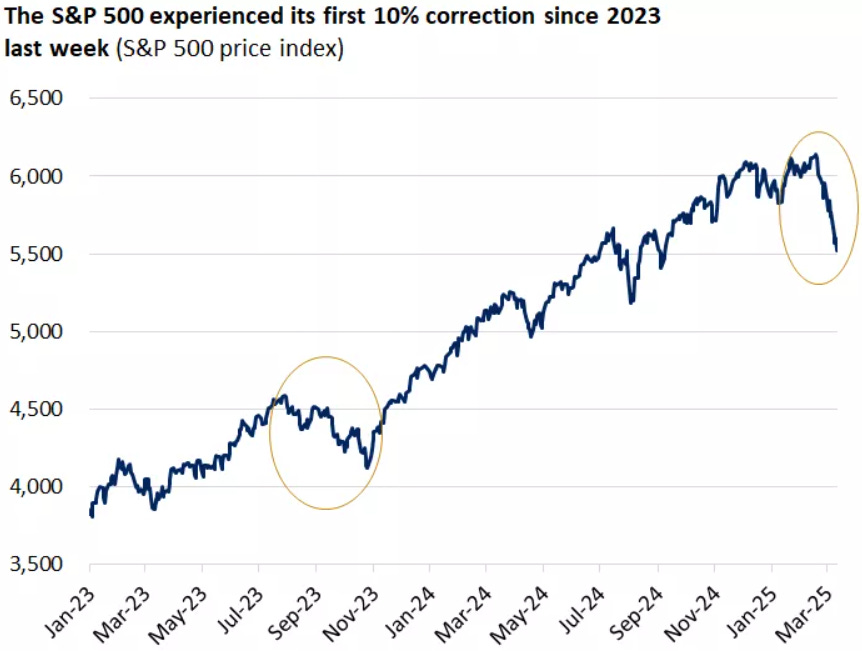
Over the past week, the stock market experienced ongoing turbulence, with the S&P 500 momentarily slipping into correction territory, declining 10.1% from its recent peak.

The Nasdaq, dominated by technology stocks, has seen a peak-to-trough decline of approximately 14% this year.
This marks the first instance of the S&P 500 dropping by 10% or more since October 2023, a span of nearly 1.5 years.
This market retreat is occurring amid several concerns:
The U.S. economy appears to be decelerating. First-quarter data suggests a slowdown in consumer spending, while surveys of consumer sentiment reveal a broader decline in confidence.
This economic softening is happening against a backdrop of heightened uncertainty surrounding tariffs and government policy. The ambiguity around tariffs is weighing not only on consumers but also on businesses, which may be postponing expenditures or capital-market activities until greater clarity emerges.

Market downturns are a common occurrence, with historical data showing that, in any given year, we typically experience one to three corrections ranging from 5% to 15%.

On a granular level we can see a lot of red.
Biggest losers included:
Adobe (ADBE) down 12%
Apple (AAPL) down 11%
Starbucks (SBUX) down 8%
McDonald’s (MCD) down 7%
Walmart (WMT) down 7%
Texas Instruments (TXN) down 7%
Uber (UBER) down 6%
Verizon (VZ) down 5%
and many, many others.
Notable News
Value Outperforming Growth
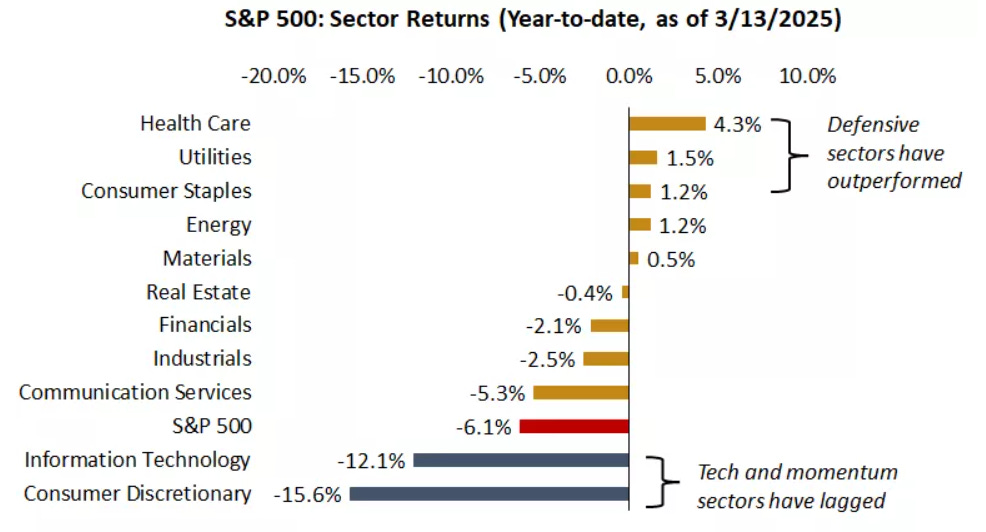
As noted above, so far in 2025, 5 out of the 11 S&P 500 sectors have recorded gains.
Defensive and cyclical sectors have outpaced technology and growth sectors.
Bonds Are Outperforming

Bond markets have surpassed equity markets, generating positive returns as investors have sought safe havens amid persistent uncertainty and heightened volatility.
Treasury bond yields have significantly declined from their earlier peaks this year, driven by growing concerns over economic growth and expectations of increased Federal Reserve rate cuts.
This reduction in yields has bolstered higher bond prices.
International vs US

This year, international markets have surpassed U.S. stocks in performance. Notably, stock markets in Europe and China—especially Chinese tech stocks—have all posted positive year-to-date returns, with the EuroStoxx index gaining over 10%.
This stronger performance is driven by investors shifting away from higher-valuation U.S. stocks toward global markets that provide more attractive valuations and a mix of growth and value opportunities.
Furthermore, Europe, particularly the German stock market, has thrived, fueled by central banks cutting interest rates and governments ramping up fiscal stimulus to bolster economic growth.
Earnings This Week

As always, we will cover this on our YouTube channel, and for those that aren’t subscribed, we would love to have you in our community which is near 85,000:

Fear and Greed Index

2 Beaten Down Semiconductors
Let us dive into these 2 Stocks:
I have used the following criteria to help identify these cheap stocks:
Margin of Safety 20%+
Upside 40%+
Taiwan Semiconductors (TSM)
Taiwan Semiconductor Manufacturing Company (TSMC) is the world's largest dedicated semiconductor foundry.
It manufactures chips for companies like Apple, NVIDIA, and AMD, but does not design its own.
TSMC produces cutting-edge semiconductors using advanced process nodes like 3nm and 5nm.
Its dominance in chip fabrication makes it a key player in global tech and supply chains.

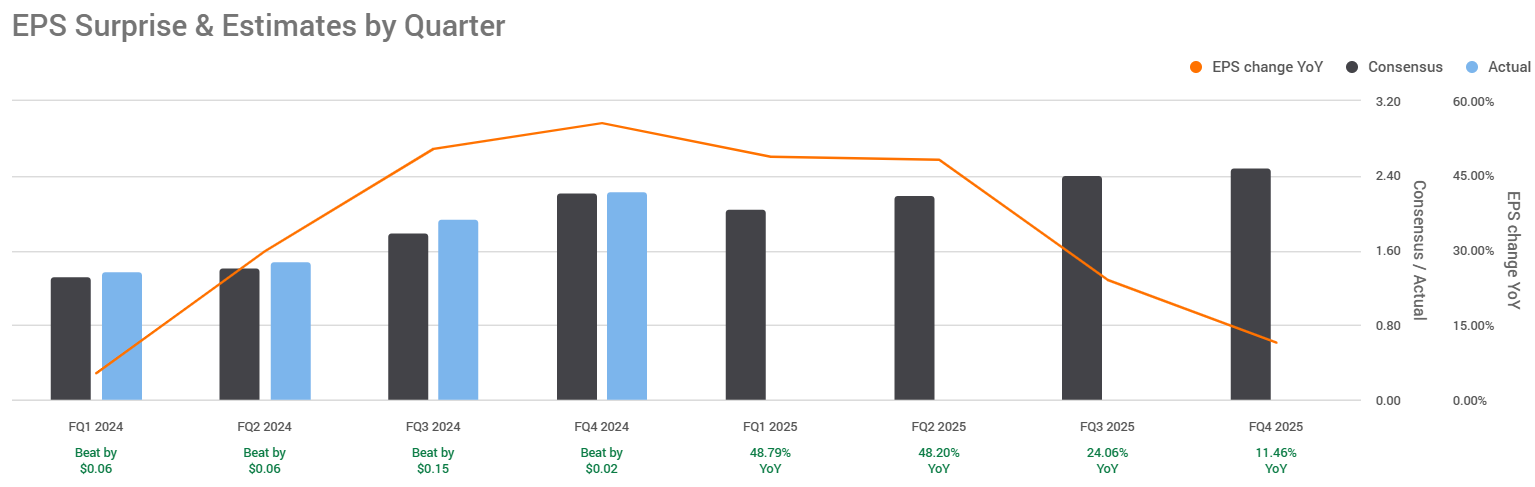
They have outperformed in all of their last 4 quarters (vs analyst expectations), and expect double digit growth in the next 4.
TSMC's income streams include:
Wafer Fabrication – Revenue from manufacturing semiconductors for companies like Apple, NVIDIA, AMD, and Qualcomm.
Advanced Process Nodes – Higher pricing for cutting-edge chip technologies (e.g., 3nm, 5nm).
Specialty Technologies – Earnings from advanced packaging, chip testing, and silicon photonics.
R&D and Licensing – Income from intellectual property, design collaborations, and process innovations.
Government Incentives & Grants – Support from governments for expanding semiconductor production and technology leadership.
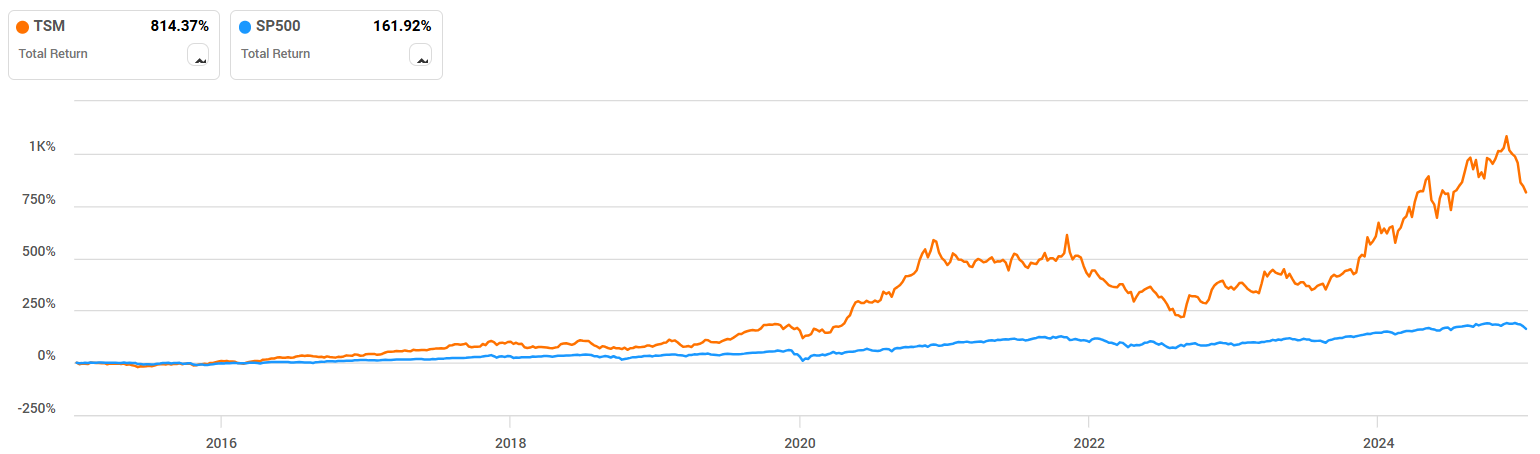
They have massively outperformed against the S&P 500 over the last 10Y.

We get an undervaluation signal as the current Forward P/E of 19.1x sits below the 5Y average.

ROIC is consistently very high in the mid 20’s.
Margins look very strong, with operating showing signs of efficiencies, going from 38% 10Y ago to 46% now.

They also have a very strong balance sheet as Net Debt to EBITDA sits at 0 consistently for the last 10Y.
Remember this is the number of years it would take them to pay off all of their debt, net of cash on hand.
As per below, Wall Street see 41% upside over the next 12 months.

When we last ran it through our valuation model our intrinsic value came to $235:

So, in conclusion for TSM, we see around a 25% margin of safety around the $176 mark with Wall Street indicating 41% upside.
Marvell Technology (MRVL)
Marvell Technology (MRVL) designs and develops semiconductors primarily for data infrastructure, including networking, storage, and cloud computing.
Its chips are used in data centers, 5G networks, and AI applications.
The company focuses on high-performance, power-efficient solutions for enterprise and carrier markets.
Marvell’s customers include major tech firms like Microsoft, Google, and various telecom providers.
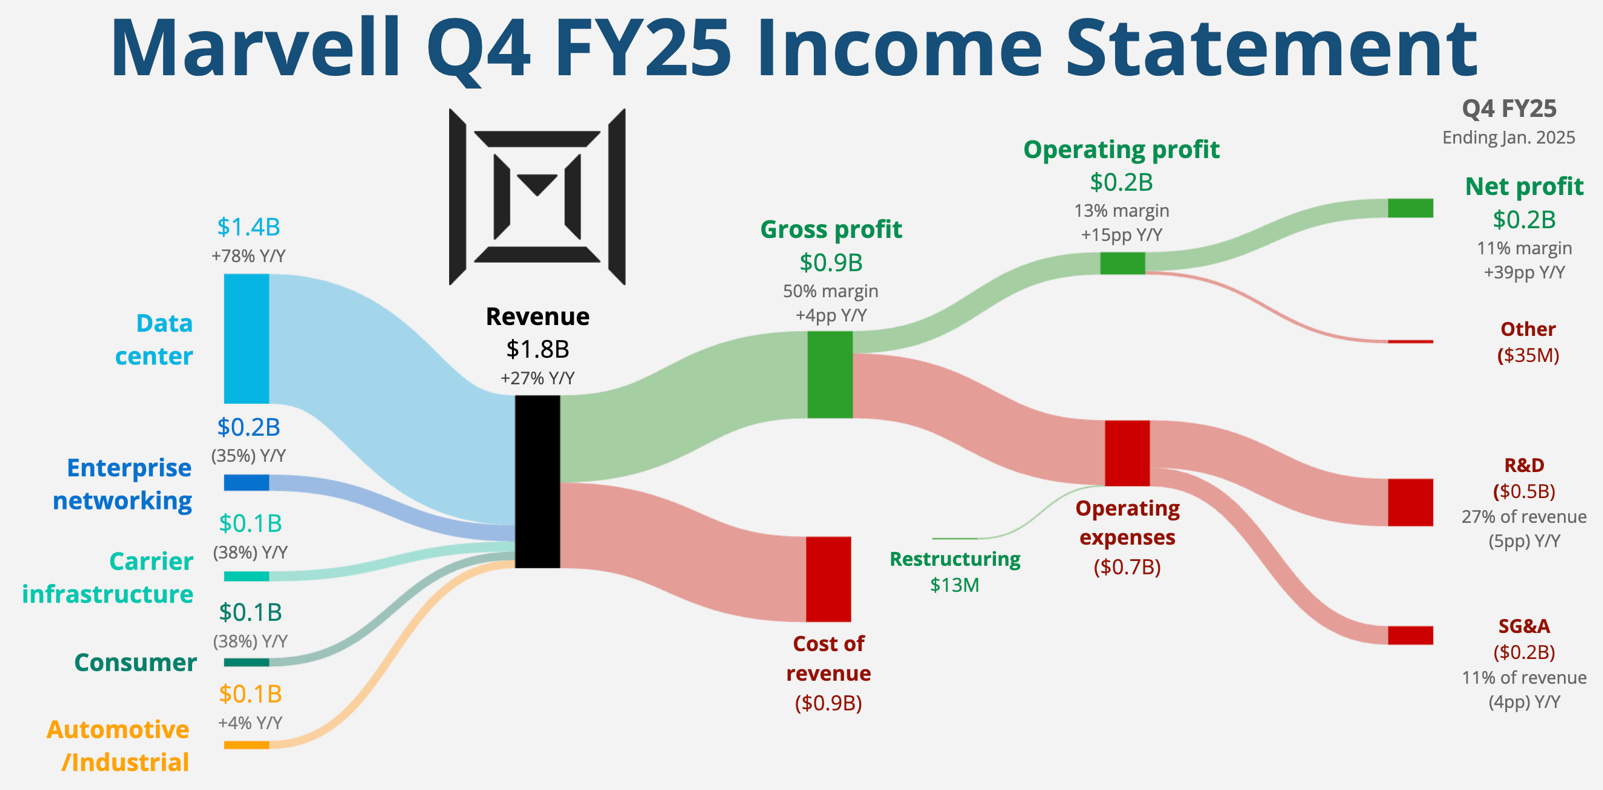
Marvell Technology's income streams include:
Networking Chips – Revenue from semiconductors used in data centers, 5G infrastructure, and enterprise networking.
Storage Solutions – Earnings from chips designed for SSD controllers, cloud storage, and data processing.
Custom ASICs – Income from specialized chip designs for AI, cloud computing, and automotive applications.
Wireless & 5G – Revenue from chips used in telecom networks and wireless communication infrastructure.
Automotive & Industrial – Earnings from semiconductors for connected vehicles, automation, and industrial applications.

They have outperformed in their last 4 quarters (vs analyst expectations).
They anticipate double digit growth at a minimum against the year-on-year EPS comparative for the next 4 quarters.

They have massively outperformed against the S&P 500 over the last 10Y.

They also trade significantly below their 5Y historical Forward P/E that sits at 35.1x, with their current valuation being 24.6x.

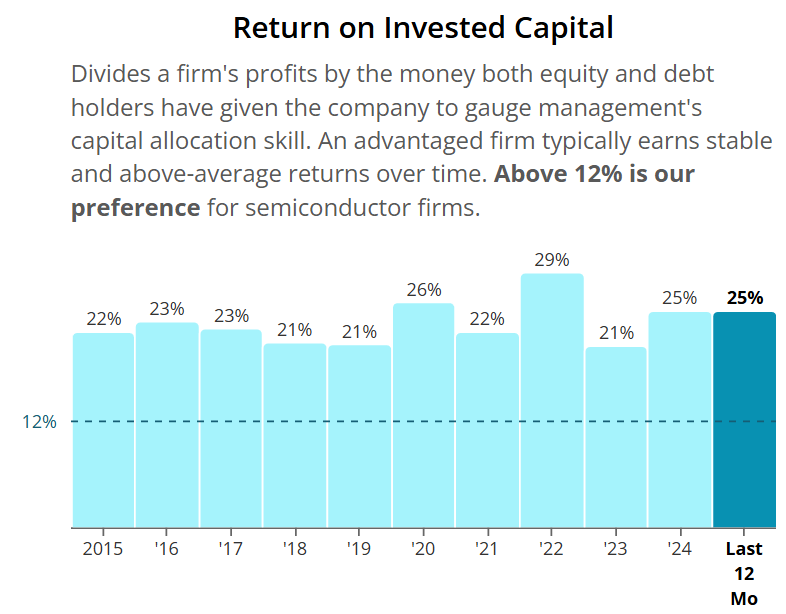
ROIC is very inconsistent and not at the minimum levels we like to see of 12% in this industry, therefore we would need to consider this when thinking about the margin of safety.

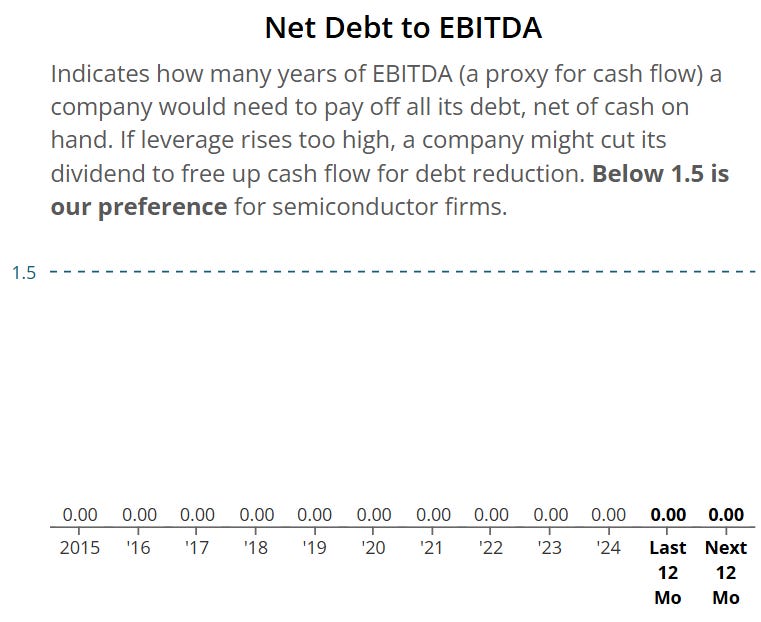
Net Debt to EBITDA is slightly higher than the 1.5 we want to see although it is expected to reduce to 1.05 in the next 12 months.

As per below, Wall Street see 71% upside over the next 12 months.

When we last ran it through our valuation model our intrinsic value came to $101:
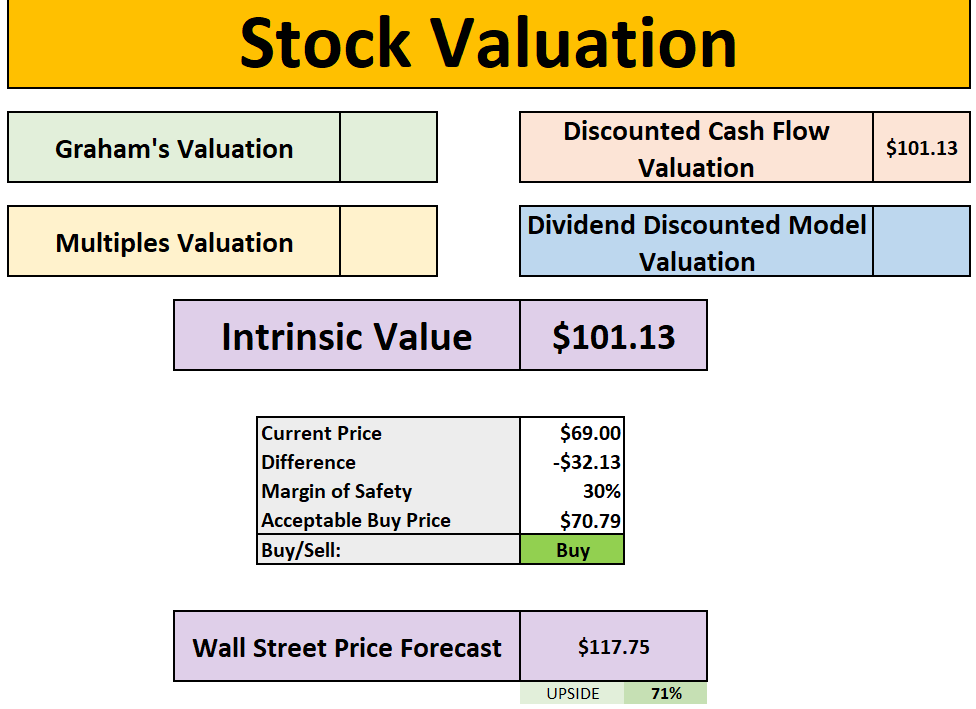
So, in conclusion for MRVL, we see around a 30% margin of safety around the $71 mark with Wall Street indicating 71% upside.
Stock Resources
Stock Valuation Model
If you are interested in valuing stocks yourself, we have created a valuation model below which you can pick up, this is the same version we use in our YouTube analysis:

Seeking Alpha

They are one of the main stock analysis websites I use in my videos and you can get $30 OFF discount below.
TipRanks
To find the predicted upside of stocks, I typically use TipRanks, for example, using their system for Amazon (AMZN) we get the below:

They currently have a 50% offer below.
50% OFF TipRanks:
Patreon
Join our community in the Patreon where we discuss weekly buy and sells.
Conclusion
We have just gone through 2 Beaten Down Semiconductor Stocks.
I hope you all have a great week ahead!
Thanks For Reading!
If you’d like to support this work feel free to buy me a coffee. The proceeds will contribute to the running costs of the newsletter.
Join the community of investors - subscribe now to receive the latest content straight to your inbox each week and never miss out on valuable investment insights.
If you found today’s newsletter helpful, please consider sharing it with your friends and colleagues on social media or via email. Your support helps to continue to provide this newsletter for FREE!
Note:
I am not a financial advisor or licensed professional. Nothing I say or produce anywhere, should be considered as advice. All content is for educational purposes only. I am not responsible for any financial losses or gains. Invest and trade at your own risk.
Nice inferences and a mix of content and graphs from different sources
You seem more bullish on Marvell than Broadcom. May I ask why as Broadcom will win the race or do you think it's like a Nvidia/ AMD. Both will win but in different ways and why?
Cheers